


INTRODUCTION
Method study is a systematic method of analysing the method of doing a job including human movements involved in it. So, it is the process of analysing the methods involved in a workflow to increase productivity. It deals with doing the work in a better way, with less time and effort. That is why it is also termed work simplification.
A procedure for examining the various activities associated with the problem which ensures a systematic, objective and critical evaluation of the existing factors and in addition an imaginative approach while developing improvements
Method study proper is concerned with broad investigation and improvement of a shop/section, the layout of equipment and machines and the movement of men and materials.
The main purpose of the method study is to eliminate unnecessary operations and to achieve the best method of performing the operation.
Important objectives of method study are
- The improvement of processes and procedures.
- Factory and workplace layout improvement.
- Improvement in the design of plant and equipment.
- Reduction in unnecessary fatigue and movements.
- Use of improved materials, machines and manpower.
- Better Working conditions.
The Function of Method Study
Method study does not replace the ability to make the best use of available information, the inventive genius or the organizing ability necessary to develop new methods. What the analytical approach of method study does, by its carefully planned sequence of analysis, is to show where change is likely to be most effective by highlighting unnecessary activities and showing where improvements are possible.
In this way, thoughts are directed into channels likely to be profitable, and any inherent flair for improvements the members of the work-study team may possess stands the best chance of finding full expression. Thus, method study enables the ordinary man to improve methods and at the same time avoid the dangers of taking shortcuts.
Scope of Method Study
The scope of the method study is not restricted to only manufacturing industries. Method study techniques can be applied effectively in-service sector as well. It can be applied in offices, hospitals, banks and other service organizations. The areas to which method study can be applied successfully in manufacturing are:
- To improve work methods and procedures.
- To determine the best sequence of doing work.
- To smoothen material flow with a minimum of backtracking and to improve the layout.
- To improve the working conditions and hence to improve labour efficiency.
- To reduce monotony in the work.
- To improve plant utilization and material utilization.
- Elimination of waste and unproductive operations.
- To reduce the manufacturing costs through reducing the cycle time of operations.
The task of work simplification and compatible work system design concerns the following
- The layout of shop floor and working areas or work stations.
- Working conditions i.e. ergonomics etc.
- Handling distances (material movement)
- Tooling and equipment used.
- Quality standards to be achieved.
- Operators and operations in achieving the production targets.
- Materials to be used.
- Power required and available.
- Work cycle time.
Procedure Involved in Methods Study
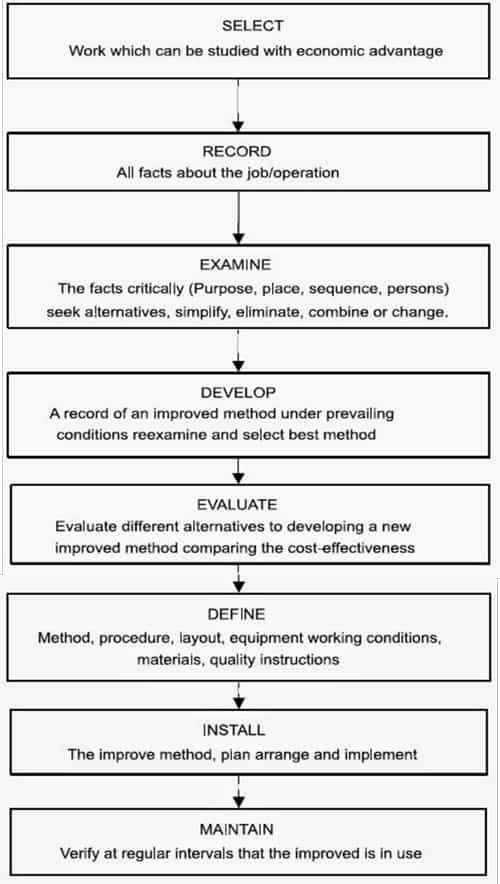
The basic approach to method study consists of the following eight steps. The detailed procedure for conducting the method study is shown in Fig.
Method Study Symbols for Recording the Facts
The graphical method of recording was originated by Gilbert, in order to make the presentation of the facts clearly without any ambiguity and enable them to grasp them quickly and clearly. It is useful to use symbols instead of written descriptions.

Operation
An operation takes place when there is a change in the physical or chemical characteristics of an object. An assembly or disassembly is also an operation. This symbol is used for the activities of grasp, position, use, release, etc. of a tool, component or material.

Transport
This refers to the movement of an object or operator or equipment from one place to another. When the movement takes place during an operation, it is not called transport.
Example: Moving the material by a trolley Operator going to the stores to get some tools.
![]()
Inspection
Inspection is checking an object for its quality, quantity or identifications. Example: Checking the diameter of a rod. Counting the number of products produced etc. The symbol for inspection is not much used because the hand movements when inspecting an article (holding it and examining it visually or gauging it) may be classified as “operations” on the two-handed chart. It may, however, sometimes be useful to employ the “inspection” symbol to draw attention to the examination of a piece.

Delay
Delay occurs when an object or operator is waiting for the next activity. Example: An operator waiting to get a tool in the stores. Workpieces stocked near the machine before the next operation

Permanent Storage
Storage takes place when an object is stored and protected against unauthorized removal.
Example: Raw material in the storeroom.

Step 1: SELECT
Select the work worth studying and define the objectives to be achieved. An objective may be to reduce the manufacturing cost, or to reduce bottlenecks or to reduce fatigue incurred by the workers in order to increase their efficiency.
There are three factors that should be kept in mind when selecting a job.
- Economic or cost-effective considerations
- Technical considerations
- Human considerations
- Cost is the usual basis for the selection of operations, sections or departments likely to benefit from method study. The following defects in an organization indicate where method study is likely to bring worthwhile savings:
-
- Poor use of materials, labour or machine capacity, resulting in high scrap and reprocessing costs.
- Bad layout or operation planning, resulting in unnecessary movement of materials.
- Existence of bottlenecks. Work begins to pile up.
- Inconsistencies in quality.
- Highly fatiguing work.
- Employees complain about their work without logical reasons. Labour discontent.
- The workload is unevenly distributed. Some workers are over-burdened and get excessive overtime and some are under-loaded with a lot of spare time.
- Areas of the high accident rate.
- Bad quality of work.
The question is whether a change is likely to achieve the following results sufficiently to make the cost of the study worthwhile:
- Increase production and reduce costs.
- Maintain it with less labour, materials or equipment.
- Improve quality without additional labour or equipment.
- Improve safety conditions.
- Improve standards of cleanliness and house-keeping
- Reduce scrap.
Economic Aspects
The method study involves cost and time. If sufficient returns are not attained, the whole exercise will go to waste. Thus, the money spent should be justified by the savings from it. The following guidelines can be used for selecting a job:
- Bottleneck operations are holding up other production operations.
- Operations involving excessive labour.
- Operations producing a lot of scrap or defectives.
- Operations having poor utilization of resources.
- Backtracking of materials and excessive movement of materials.
Technical Aspects
The method study man should be careful enough to select a job in which he has the technical knowledge and expertise. A person selecting a job in his area of expertise is going to do full justice.
Other factors which favour selection in technical aspect are:
- Job having inconsistent quality.
- Operations generating a lot of scraps.
- Frequent complaints from workers regarding the job.
Human Considerations
Method study means a change as it is going to affect the way in which the job is done presently and is not fully accepted by the workman and the union. Human considerations play a vital role in method study. These are some of the situations where the human aspect should be given due importance:
- Workers complaining about unnecessary and tiring work.
- More frequency of accidents.
- Inconsistent earning.
Step 2: RECORD
Record all the relevant information pertaining to the existing method (if any) in detail and in the form of a chart to obtain a clearer picture about the same.
Recording can be done with the help of the following aids:
- Process Charts
- Diagrams
- Motion and Film Analysis (Micromotion and Memo motion Studies)
PROCESS CHARTS
Process charts are one of the finest recording techniques that are used in work-study. The various types of process charts are as follows:
- Operation Process Chart (Outline Process Chart)
- Flow Process Chart
- Travel Charts
- Two-Handed Process Chart
- Multiple Activity Chart
OPERATIONAL PROCESS CHARTS (OUTLINE PROCESS CHARTS):
- An operation process chart/outline process chart is a process chart that gives an overall view of a process by recording only the main operations and sequences in proper order.
- As such, such a chart requires only the symbols for “Operations” and “inspection”.
- Actually, an outline process chart is the beginning of a detailed analysis.
- In this chart, a brief note of the nature of each inspection and operation is written beside the symbol.
- The allowed time if known is added as well.
ADVANTAGES
- Improved plant layout.
- For specifying the basic manufacturing system.
- For determining the sequence of assembly.
- To introduce a manufacturing system to new technical personnel.

FLOW PROCESS CHARTS
- A flow process chart is a graphical representation of the sequence of steps or tasks (workflow) constituting a process, right from raw materials to the final finished product.
- It serves as an important tool for examining the process in detail and identifying areas of possible improvement.
- It is also called a process map.
- It is basically an extension of the operation process chart in which operations, inspection, storage, delay and transportation are represented.
Flow process chart can be of three types
- Man type flow process chart – This type of flow process chart records the activities by man.
- Material type flow process chart – This type of flow process chart deals with the events of materials and records what happens to the material.
- Equipment type flow process chart – This type of flow process chart records the events of equipment used in all stages of product development.
EXAMPLES
Material type flow process chart


Equipment type flow process chart

TRAVEL CHARTS
- A chart that represents the quantitative data regarding the movement of workers, materials or equipment between different stations in a tabular form during a given period of time is called a travel chart.
- It can be used instead of string diagrams, as it’s much easier to construct and takes less time as compared.
- It becomes very easy to record complex movements with the help of travel charts.
- Travel charts usually consist of a square, which further consists of a number of smaller squares. Each small sequence in the square represents a workstation. A diagonal line is drawn from top left to bottom right.
ADVANTAGES
- It is helpful in planning mutes and materials handling systems so as to reduce manufacturing cycles.
- It is useful in speeding up the flow of materials so as to reduce work-in-process and inventory control problems.
- A travel chart assists in planning the location of production departments so as to make the best use of available floor space.
- It is a device for reducing material handling and labour costs.
- It is a useful tool for comparing alternative layouts so as to plan the best layout for the plant.
EXAMPLE
For example, in the travel chart given below BF and CD departments having maximum weights (4 each) require the highest proximity to each other. Next in priority of proximity are BD and DF combinations in layout. A travel chart is very useful in highlighting the distance, the volume that materials have to be moved among the different work stations.

TWO-HANDED PROCESS CHARTS
The Left- and Right-Hand Chart is a process chart in which the activities of a worker’s hands (or limbs) are recorded in their relationship to one another.
It is a specialized form of process chart because it shows the two hands (and sometimes the feet) of the operative moving or static in relation to one another, usually in relation to a time scale.
One advantage of incorporating a time scale in the chart form is that the symbols for what the two hands are doing at any given moment are brought opposite each other.
The two-handed process chart is generally used for repetitive operations when one complete cycle of the work is to be recorded.
Need of a Sizing System for Indian Apparel Industry
Research study on the requirement of a Sizing System exclusive to Indian Apparel Industry
Practical Garment Production Process – A Case Study
End-to-End detailed garment production process
Different Technological Methodologies Used in Garment Industry
Apparel Manufacutring technological advancements adopted by different countries
The recording is carried out in more detail than is normal on flow process charts. What may be shown as a single operation on a flow process chart may be broken down into a number of elemental activities which together make up the operation.
EXAMPLE
Given below is an example of cutting glass tubes:

MULTIPLE ACTIVITY CHARTS
Where a number of workers work in a group or an individual operator handles two or more machines, their activities have to be coordinated for achieving proper results. A multiple activity charts records simultaneously the activities of all the workers and machines on a common time scale and thus shows inter-relations between them.
Purpose of Multiple Activity Chart
- To detect idle times being enforced on machines and workers.
- To optimise work distribution between workers and machines.
- To decide the number of workers in a group.
- To balance the work teams.
- To examine the interdependence of activities.
- Ultimately, to develop an improved method of accomplishing a task and to have an effective labour cost control.
Construction of Multiple Activity Chart
- A separate vertical bar or column is there to represent each subject (which may be a machine or an operator).
- A common time scale is provided for all the subjects.
- Activities of each subject in relation to those of the others are marked in the respective columns.
- Previously conducted time studies provide the time values for each activity.
- A brief description of each activity is marked on the chart.
- Working and idle times are marked differently on the chart.
EXAMPLE
This figure shows a Multiple Activity Chart:

Analysis of Multiple Activity Chart
- Rearrange the work cycle to minimize men or machine idle times.
- Simplify the operations.
- Combine or eliminate some of the elements etc.
Applications of Multiple Activity Chart
- Plant repair and maintenance.
- Construction jobs.
- Planning teamwork.
Gang Process Chart
A gang process chart is another type of multiple activity chart which portrays the relationship of the activities carried out by different members of a group (or gang) with respect to one another while doing a job such as riveting. The aim (of the chart) is to reduce idle and ineffective time and to improve the efficiency of the gang operations.
A gang process chart looks like a man-machine chart with the difference that instead of one operator, there are a number of operators or workers.
Analysis of Multiple Activity Chart:
- Rearrange the work cycle to minimize men or machine idle times.
- Simplify the operations.
- Combine or eliminate some of the elements etc.
Applications of Multiple Activity Chart:
- Plant repair and maintenance.
- Construction jobs.
- Planning teamwork.
Gang Process Chart:
A gang process chart is another type of multiple activity chart which portrays the relationship of the activities carried out by different members of a group (or gang) with respect to one another while doing a job such as riveting. The aim (of the chart) is to reduce idle and ineffective time and to improve the efficiency of the gang operations.
A gang process chart looks like a man-machine chart with the difference that instead of one operator, there are a number of operators or workers.

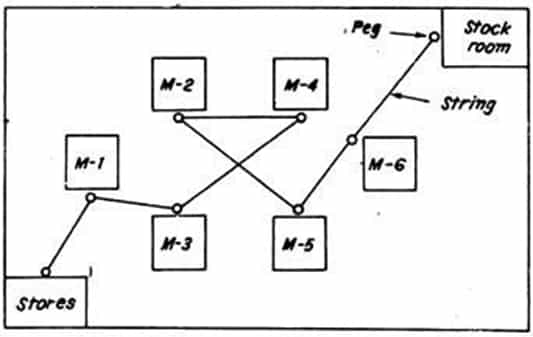
STRING DIAGRAM:
- When the paths are many and repetitive, a flow diagram becomes congested and it is neither easy to trace it nor to understand. Under such conditions, a string diagram is preferred.
- String Diagram is a model or a scale plan of the shop, in which every machine or equipment is marked and a peg or pin is struck by or in the area representing a facility. A continuous coloured thread or string traces the path taken up by the materials or workers while performing a particular operation.
Construction of String Diagram:
- Draw the scale layout of the shop (working) area and mark various features, such as machinery, workbenches, store, etc.
- Mount this scaled drawing on a soft board and strike pins or pegs at all the places which form the path of the workers and materials. More pegs may be stuck in between the facilities to trace more or less, the actual path of men and materials.
- A continuous coloured stretchable string, taken from the first to the last peg, is wound to mark the path followed by workers or materials.
- As many as 15 times, a thread can be taken around each peg easily and yet it will not be difficult to comprehend the various movements. The thread when measured gives approximately the total distance travelled by a worker or the material.
Uses of String Diagram:
A string diagram picturises the movements:
- Is very useful in dealing with complex movements and plant layout and design problem.
- Indicates clearly, backtracking, congestion, bottlenecks, and over and underutilised paths on the shop floor,
- Measures the distances involved and points out whether a work station is suitably located,
- Traces existing path of movements for necessary modifications if any,
- Is preferred when movements are not regular as regards their frequency and distance travelled
- Shows the pattern of movements and thus helps in deciding the most economical routes to do a particular operation,
(Vii) Is advantageous in studying the movements of:
- An individual operator handling a number of machines,
- A group or gang moving from one machine or workbench to another, and
- Workers/materials in an assembly or repair shop.
Drawbacks of String Diagram:
If the workers or materials move in some irregular or curvilinear path, it is not possible to trace exactly the same on the string diagram and thus 1.0 estimate can be made regarding the total distance travelled by the workers or the materials.
CYCLE GRAPHS AND CHRONO CYCLE GRAPHS: –
- Both these techniques were developed by Gilbreth and both these techniques are used to record the motion path of an operator.
- These techniques require filming equipment, as the movement of the operator are to be filmed in these methods.
- Rapid movements which are very difficult for the human eye to trace are traced by these techniques.
Drafting a cycle graph:
- A small electric bulb or any small light source is attached to the hand, finger or any other part of the body whose motion is to be analysed.
- The path of the light from the bulb would therefore be the same as that of the body member. As the bulb moves through space for a complete cycle, the path of the bulb is photographed by various filming equipment.
- The direction of the operator however cannot be traced out in cycle graphs, as it shows a continuous line of light of the path through which the operator moves.
Why is chrono cycle graph used?
- The direction of the operator however cannot be traced out in cycle graphs. For this purpose, a Chrono Cycle Graph is used.
- Chrono Cycle Graph also indicates the direction of the body movements of the operator. It incorporates a system of interrupting the light source from about 10 to 30 times per second.
- As such, instead of getting a continuous line of the path, a path consisting of numerous pear-shaped spots is attained on the photographic plate.
- The sharp end of the pear-shaped path shows the direction of movement and the shape of the pear indicates the shape.
- Higher speed would correspond to more elongated spots with longer gaps between them and vice versa for lower speeds.


MOTION AND FILM ANALYSIS (MICRO MOTION AND MEMO MOTION STUDIES):
- Micromotion study is a technique that is most desirable for those operations or activities that are of short duration and which are repeated several numbers times.
- These include the operations or motions needing very small time and as such, it becomes difficult to measure time for these motions accurately, and the time required by these motions cannot be neglected due to repetitive operations.
- As a result, to analyse such movements, a much precise and detailed method is essential.
- Thus, the micro-motion study is the technique of recording and analysing the time of basic elements of an operation with the aim of achieving the optimum method of performing the operation.

S.I.M.O. (Simultaneous-Motion-Cycle) Chart
It is an extremely detailed left-and right-hand operation chart. It shows on a common time scale the simultaneous minute movements (therbligs) performed by the two hands of an operator. Besides hands, the movements of other limbs of an operator may also be recorded. The time scale is represented in winks (1/2000 of a minute).
S.I.M.O. chart is generally used for micromotion analysis of:
- Short cycle repetitive jobs, high order skill jobs, and finds applications in jobs like component assembly, packaging, repetitive use of jigs and fixtures, inspection, etc.
- A simo chart shows the relationship between the different limbs of an operator; for example, at any instant, it can be found what the one hand is doing with respect to the other, in terms of therbligs. In addition to these relationships, a simo chart also records the duration of micromotions.
Construction of S.I.M.O:
- Using a 16-mm movie camera a number of short and repetitive work cycles are filmed (at 16 frames per second) as the worker performs the job. For recording time, a timing device (wink counter) is placed in the field of view.
- The film thus obtained is viewed and the most efficiently performed one whole cycle is selected for analysis. (A cycle involves complete series of motions from beginning to the end for completing a unit of work).
- A special projector is employed to study the work cycle recorded on the film. The work-study Engineer analyses the film, frame by frame, studying one frame at a time, and concentrating first on the left-hand and then on right-hand movements.
- The data noted in step-3 is recorded in the form of a therblig chart. The durations of actual movements are also read from the wink counter.
- A simo chart is then drawn for further study and analysis.

- This simo chart of the existing method is subjected to a questioning procedure based on the principles of motion economy; the purpose is to develop a better and improved procedure for doing a job.
- A new Simo chart is then prepared for the new method.
- The new method is then checked as regards the advantages claimed for the same.
- A simo chart is advantageous because it permits very accurate and detailed analysis. The work cycle from the film can be studied at ease, peacefully and away from the disturbing surroundings of the actual workplace. However, the technique is limited because of the high cost of filming and analysis.
Step 3: EXAMINE
This is an important stage of Method Study; the information that is being collected is scrutinized, and each part of the job is critically examined to determine whether any part may be:
- Eliminated altogether
- Combined with another part of the job
- Changed in sequence
- Simplified to reduce the content of work involved
For effective examination of the facts, the following questions are generally asked:
- What is done and why?
- Who does it and why that person?
- Where is it done and why there?
- When is it done and why then?
- How is it done and why this way?
Rearranging, simplifying, combining, eliminating or modifying the facts or records obtains a base for an improved method.
Step 4: DEVELOP
- The alternatives selected are used to reshape and develop the new method, layout or procedure.
- These may require test runs to determine their feasibility.
- It is preferable that tests of this nature are carried out at a place away from the worksite, if possible.
- It is good to involve the departmental officers to ease the problems of acceptance for the new method in the department.
- The end result must be an improved method.
- It must be acceptable to the departmental staff and workers.
- It must meet all their practical requirements and technical specifications.
Step 5: EVALUATE
- The DEVELOP stage of the method study procedure should result in proposed changes to existing ways of carrying out the work under review.
- Sometimes the changes to be made are clear-cut and a revised method can be clearly defined.
- Reports are submitted in which very broad costs and benefits are associated with each potential change.
- A relative weighting is assigned to each factor to indicate its relative importance to the organization. This weighting must be achieved by discussion with the managers or supervisors involved in the work area.
- Each potential method is then “scored” against each factor (normally on a simple 1 to 5 or 1 to 10 scale). This scoring can be based on quantitative data, where this is available, or on subjective judgement.
- Finally, the score of each factor is multiplied by the weighting for that factor and the resultant sum gives an overall score for that particular potential method.
Step 6: DEFINE
Once a decision has been taken on the changes in method to be adopted, it is important that the new method should be strictly defined.
It is desirable to prepare a written standard practice, also known as an “operative instruction sheet”.
- It records the improved method for future reference, in as much detail as may be necessary.
- It can be used to explain the new method to management, supervisors and operatives. It also advises all concerned, including the works engineers, of any new equipment required or of changes needed in the layout of machines or workplaces.
- It is an aid to training or retraining operators and can be used by them for reference until they are fully conversant with the new method.
- It forms the basis on which time studies may be taken for setting standards.
Step 7: INSTALL
Prior to installing the new method, decisions must be taken on:
- Ordering of new plants or materials (if any)
- Phasing in changes in the production process
- Deciding the extent of redeployment
- Introducing new documentation procedures
- Setting new quality standards and test procedures
- A detailed timetable for effecting these changes
The end product of the installation stage is that the new method is in operation at the work site; there is complete control of line management; and finally, all members of the department are fully conversant with the method.
Step 8: MAINTAIN
- When a method has been installed, it tends to change slowly as a result of minor alterations made by the operators or supervisors.
- To detect any alterations, a reference standard (job instruction sheet) is needed against which the job can be compared.
- Likewise, a corresponding document for an incentive scheme, which also contains details of the standard time for each job, called a job specification, is prepared.
With this data, changes in the method can be detected. If changes are considered to be useful, the instruction sheet can be amended to incorporate them. If they are thought undesirable, they can be removed through line management.
This post is very informative and the images are very helpful. It’s great to have a resource like this to quickly understand the concept. The author did an amazing job of breaking down the concept in an easy to understand manner. Now I like to introduce Definepedia is an online encyclopedia and dictionary platform that provides reliable and accurate information and definitions on various topics. Definepedia.in