

Fabric costing and production efficiency are essential for managing expenses and maximizing output in textile manufacturing. This article details calculations for total fabric cost, cost per unit, production rate, machine efficiency, labor productivity, and waste percentage, applicable to fabrics like cotton, polyester, and blends. Each calculation is supported by formulas, practical examples, and references to industry standards. These metrics enable manufacturers to optimize resource utilization, reduce costs, and improve production processes, ensuring competitiveness and sustainability.
1. Introduction to Fabric Costing and Production Efficiency
Fabric costing involves calculating the total expenses incurred in producing textiles, including materials, labor, and overheads. Production efficiency measures how effectively resources are utilized to maximize output and minimize waste. Accurate costing and efficiency calculations are vital for pricing, budgeting, and process optimization in textile manufacturing. This article provides formulas and examples to quantify these metrics, complementing resources on thermal properties, air permeability, and other textile characteristics.
2. Key Fabric Costing and Production Efficiency Calculations
2.1 Total Fabric Cost
Purpose: Calculates the total cost of producing a given quantity of fabric, including materials, labor, and overheads.
Example: For material cost = $500, labor cost = $200, overhead cost = $150: TC = 500 + 200 + 150 = $850
Reference: Textile Institute, Costing in Textile Manufacturing
2.2 Cost per Unit of Fabric
Purpose: Determines the cost of producing one unit (e.g., per kg or meter) of fabric.
Example: For total cost = $850, fabric weight = 100 kg: CPU = 850 / 100 = $8.50/kg
2.3 Material Cost
Purpose: Calculates the cost of raw materials, accounting for waste.
Example: For 103 kg of cotton, unit cost = $4/kg, 3% waste: MC = 103 × 4 × (1 / (1 – 0.03)) ≈ $424.74
2.4 Production Rate
Purpose: Measures the quantity of fabric produced per unit time.
Example: For 100 kg produced in 8 hours: PR = 100 / 8 = 12.5 kg/h
Reference: ISO 17299-1:2014
2.5 Machine Efficiency
Purpose: Evaluates the efficiency of production machines based on actual versus theoretical output.
Example: For actual output = 100 kg, theoretical output = 120 kg: ME = (100 / 120) × 100 ≈ 83.33%
2.6 Labor Productivity
Purpose: Measures the output per worker, indicating labor efficiency.
Example: For 100 kg produced by 5 workers in 8 hours: LP = 100 / (5 × 8) = 2.5 kg/worker·h
2.7 Waste Percentage
Purpose: Quantifies the proportion of material lost during production.
Example: For 3 kg waste from 103 kg input: WP = (3 / 103) × 100 ≈ 2.91%
2.8 Cost Efficiency Ratio
Purpose: Evaluates cost-effectiveness by comparing output value to production cost.
Example: For output value = $1000, total cost = $850: CER = 1000 / 850 ≈ 1.18
3. Practical Applications and Examples
3.1 Cotton Fabric Costing and Efficiency
For producing 100 kg of cotton fabric:
- Material: 103 kg, unit cost = $4/kg, 3% waste
- Labor cost: $200
- Overhead cost: $150
- Production time: 8 hours, 5 workers
- Actual output: 100 kg, theoretical output: 120 kg
- Output value: $1000
Material Cost:
MC ≈ $424.74
Total Fabric Cost:
TC = $774.74
Cost per Unit:
CPU ≈ $7.75/kg
Production Rate:
PR = 12.5 kg/h
Machine Efficiency:
ME ≈ 83.33%
Labor Productivity:
LP = 2.5 kg/worker·h
Waste Percentage:
WP ≈ 2.91%
3.2 Polyester-Cotton Blend Fabric
For producing 100 kg of 50:50 polyester-cotton fabric:
- Material: 51.5 kg cotton ($4/kg), 51.5 kg polyester ($2/kg), 4% waste
- Labor cost: $180
- Overhead cost: $120
- Production time: 10 hours, 4 workers
- Output value: $900
Material Cost:
MC = (206 + 103) × (1 / 0.96) ≈ $321.88
Total Fabric Cost:
TC = $621.88
Cost per Unit:
CPU ≈ $6.22/kg
Production Rate:
PR = 10 kg/h
Labor Productivity:
LP = 2.5 kg/worker·h
Cost Efficiency Ratio:
CER ≈ 1.45
4. Summary Table of Key Costing and Efficiency Calculations
| Category | Formula | Example |
|---|---|---|
| Total Fabric Cost | TC ($) = Material Cost ($) + Labor Cost ($) + Overhead Cost ($) | 500 + 200 + 150 = $850 |
| Cost per Unit | CPU ($/kg) = Total Cost ($) / Fabric Weight (kg) | 850 / 100 = $8.50/kg |
| Material Cost | MC ($) = Material Weight (kg) × Unit Cost ($/kg) × (1 / (1 – Waste (%)/100)) | 103 × 4 × (1 / 0.97) ≈ $424.74 |
| Production Rate | PR (kg/h) = Fabric Weight (kg) / Production Time (h) | 100 / 8 = 12.5 kg/h |
| Machine Efficiency | ME (%) = (Actual Output (kg) / Theoretical Output (kg)) × 100 | (100 / 120) × 100 ≈ 83.33% |
| Labor Productivity | LP (kg/worker·h) = Fabric Weight (kg) / (Number of Workers × Time (h)) | 100 / (5 × 8) = 2.5 kg/worker·h |
| Waste Percentage | WP (%) = (Waste Weight (kg) / Total Input Weight (kg)) × 100 | (3 / 103) × 100 ≈ 2.91% |
| Cost Efficiency Ratio | CER = Output Value ($) / Total Cost ($) | 1000 / 850 ≈ 1.18 |
Costing and cost estimation methods
The formulas above give the cost of fabric once it has been made. A mill also needs to know the cost of an order before it accepts the price, and the cost of a new product before the design is fixed. The methods below are used for those decisions.
Direct and indirect costs
Direct costs, such as raw material, standard labor time and machine time, vary with the quantity produced. Indirect costs, such as design, overheads, and selling and administration expenses, do not follow the same pattern for every product. A common practice is to add indirect costs as a fixed percentage of the production cost, which can misstate the cost of products that use more or less of these indirect resources than average. Activity-based costing (ABC) allocates indirect costs to products by the activities each product consumes. It is more accurate, but it needs more data and time than the traditional percentage method.
Standard costing by machine hour
Standard cost is the cost of producing a given product in a given quantity, broken down to each material and each cost element such as labor and energy. One way to build it is to calculate a cost per machine hour. For a stenter, the hourly cost adds the operator hours, the kWh of electricity, the kg of steam and the other consumables used in one hour, plus the fixed costs allocated to that hour. Each lot is then charged for the hours it spends on the machine. Because consumption is held in physical units (kWh, kg of steam, operator hours), a change in the unit price of electricity or steam can be tested quickly as a “what if” calculation.
Pricing orders by contribution margin
The contribution margin of an order is its selling price minus its variable costs. Knowing it before an order is accepted lets the mill make three decisions:
- Reject orders priced below variable cost, since each unit made adds to the loss.
- When there is spare capacity, accept orders priced above variable cost even if they are below average full cost, because they still contribute to fixed costs.
- When the mill is at full capacity, give priority to the orders with the highest contribution per hour of the bottleneck machine.
For short-term decisions of this kind, labor is often treated as a fixed cost, since the workforce is paid whether or not a particular order is run.
Estimating the cost of a new product
- Analytical estimation breaks the product into its parts (the bill of materials) and its operations, costs each one and adds them up. It needs the most data, usually from the accounts department, and is used during development and production.
- Analogical estimation compares the new product with similar products already made and adjusts their known costs.
- Parametric estimation uses cost estimating relationships: equations fitted to the cost history of past products that link cost to a few main characteristics of the design. It gives quick estimates early in design, before detailed information exists. A model is built by selecting the cost drivers, collecting data, fitting the equations by regression, testing their statistical quality and choosing the best one.
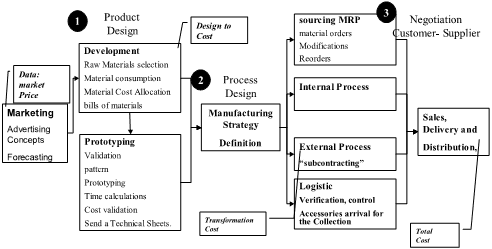
Cost estimates are needed at three decision points: during product design, when choosing the manufacturing strategy (in-house or subcontracted, location, lot size), and when quoting and negotiating with the customer.
5. Conclusion
The fabric costing and production efficiency calculations provided offer a robust framework for optimizing financial and operational performance in textile manufacturing. By quantifying material costs, labor productivity, machine efficiency, and waste, manufacturers can identify cost-saving opportunities and improve production processes. These metrics align with industry standards and support strategic decision-making for enhanced profitability and sustainability.








The treatment of waste is especially important because raw material cost often represents 50–70% of textile production cost.