
INTRODUCTION
Visual merchandising is the art and science of presenting products in the most visually appealing way, emphasizing communication with the customers through images and presentations.[ Hyunjoo Oh, JennyPetrie, 2012]. Visual Merchandising is a technique commonly and rightly called “Silent Salesman” and is widely used in the market to increase footfalls and attract shoppers and make shopping a pleasant experience for one and all [ Kaur Amandeep, 2013]. Visual merchandising is: ‘one of the visible, systematic, logical and intelligent ways of putting the stock on the floor. Visual Merchandising is offered to the customer from the exterior of the store to the interior of the store. Visual merchandising is a tool to increase sales and influences customer decisions to buy the products [ Rao Rama, Mopidevi, Lolla Sree Rama, 2013]. The visual merchandising display is the presentation of merchandise at its finest. The display is the glamour, the spark, the stage, the oomph, and sparkle that surrounds a store and makes the consumers stop, look, and buy what has been placed together with care and presented with skill. Visual merchandising displays use creative techniques in order to save both the salesperson’s and the shopper’s time by making shopping effortless [ Yolande Hefer & Michael.C.Cant, 2013]. According to research conducted by Marta Gigola [Marta Gigola, 2013] visual merchandising motivates more efficiently.
- Women(91%) than men(13%) to buy apparel
- Younger people(90%) than elder(48%) to buy apparel
- Individuals with higher incomes(100%) than those with lower incomes(25%) to buy apparel [ Marta Gigola, 2013].
Functions of visual merchandising
Visual merchandising helps in :
- Educating the customers about the product/ service in an effective and creative way.
- Establishing a creative medium to present merchandise in a 3D environment, thereby enabling long-lasting impact and recall value.
- Setting the company apart in an exclusive position.
- Establishing linkage between fashions, product design, and marketing by keeping the product in prime focus.
- Combining the creative, technical, and operational aspects of a product and the business.
- Drawing the attention of the customer to enable him to take purchase decision within shortest possible time, and thus augmenting the selling process.
- Make it easier for the customer to locate the desired category and merchandise.
- Make it easier for the customer to self-select.
- Make it possible for the shopper to coordinate and accessorize.
- Recommend, highlight and demonstrate particular products at strategic locations.[ Gudonaviciene Rasa & Alijosiene Sonata, 2015]
Visual Merchandising Impact – A Multi-Stage Process
The impact of visual merchandising is a multi-stage process. It is the one that affects the growth of motivation to buy the apparel. The first stage of the process includes noticing the apparel. Here the key role is played by sight. The second stage is the creation of the definite consumer’s attitude towards the specific apparel. The third stage is the desire to buy the apparel. The last stage of the process is the purchase of the apparel which finally meets the consumer needs [Marta Gigola, 2013].
TECHNIQUES IN VISUAL MERCHANDISING
Visual merchandising consists of mainly two techniques; interior and exterior displays, also known as in-store design and window displays. The goal of these two techniques is to attract the attention of consumers, entice them into the store, keep them in the store as long as possible, and influence purchasing decisions.
Interior Displays
In-store visual merchandising can be used to capture the attention of consumers whilst they are in the store, which is essential in the buying decision-making process. To capture the attention of the customer, the retailer must consider the customer’s needs during this process. Factors that contribute to the overall in-store design include; the store layout, store design, point of purchases displays, item display, assortment display, and signage [https://en.wikipedia.org/wiki/Visual_merchandising (accessed on 26.12.2016)].
Store Interior
The shop interior is a significant part of merchandising because designing a modern retail store can affect the profit and image of the brands. Designing a shop interior is the art of planning because it is a creative process. It is the art of drawing, composing, and selecting colors, materials, furnishings, and accessories to enrich the design of a store interior. The main purpose is to create an attractive shopping environment and to enhance the presentation of merchandise. Creating a distinctive image should be the main task of a designer because such an image will create brand recognition which will be immediately perceived by the consumers. In today’s competitive retail environment, fashion retailers struggle in order to increase their sales and to carry their brands to the wider masses. The best way to achieve this purpose is to consider the architectural and interior design [Yolande Hefer & Michael.C.Cant, 2013].
Mannequins
The use of mannequins to exhibit merchandise is of great importance. The word “mannequin” comes from the Dutch word Manneken, literally meaning ‘little man’. A mannequin is an assembled model of the human body used by retailers to demonstrate their products, especially to exhibit the draping of apparel. Mannequins help a retailer in many different ways. As and when a new fashion trend hits the market, they are the first ones to showcase it. It is through them, one gets to know about the latest collections of clothing that have arrived at a particular store. Mannequins also give an appeal to the product while letting customers know how a particular piece of merchandise would look once worn. This helps them to procure a piece of merchandise quickly. According to the study conducted by Vinamra Jain, Ashok Sharma and Pradeep Narwal [Jain Vinamra, Sharma Ashok, Narwal Pradeep, January 2012], 45.33% of the women get an idea of what they should buy only after looking through the mannequin display and 45.33% of women to rely on the mannequin display. Whenever they see a new style or design on a mannequin display, they tend to buy it.
Point of Purchase Display
Merchandise must be visible, easy to access, and there must be a range of merchandise to choose from. Having visible merchandise is essential for retailers as consumers to not only “buy what they see” but are also able to tangibly engage with the physical product. This creates an emotional connection, which can drive the customer to purchase the product. Considering these elements, merchandising gives the customer a sense of freedom of choice. Arranging stock, so it is not overcrowded and limiting the amount of merchandise on the shop floor, is an important aspect of merchandising. Over-crowded stores can create a sense of stress and anxiety, which does not encourage the consumer to shop the entire store [https://en.wikipedia.org/wiki/Visual_merchandising (accessed on 26.12.2016)].
Atmospherics
The atmospherics also have a large influence on the store environment. Atmospherics should all coordinate with each other to create a consistent ambiance and positively influence the consumer’s shopping experience and buying decision-making process. Four dimensions of store atmosphere are visual (sight), aural (sound), olfactory (smell), and tactile (touch). Visuals such as light and display are not always enough to enhance the overall ambiance of the store, and retain customer attention; therefore, other elements such as music and scents can be used [Laurent Hubrechts & Beyhan kokturk, 2012].
Lighting
Lighting is another element of visual merchandising. Lighting is essential in calling attention to merchandise in a display. A shopper’s eye is drawn automatically to the brightest item or area. Lighting treatment may be used to draw attention to the part of the display area or to coordinate the parts of the total display area. The choice of the right lighting in fashion stores should be well considered. There are numerous products that offer many choices for the shopping environment. Lighting deals with creating an ambiance and making environments visually pleasing. The cheapest and most effective starting place in getting attention and recognition is with good lighting [Yolande Hefer & Michael.C.Cant, 2013]. Good lighting can guide the customer’s eyes, reveal the color and cut of the merchandise, show the styling and tailoring details and emphasize the good qualities of the outfit, helping the merchandise to be pre-sold to customer [Gudonaviciene Rasa & Alijosiene Sonata, 2015]. The strategic use of light can change the mood of a consumer and affect their subconscious mind during their shopping experience within a retail store. A retail store with a soft ambiance and bright lights highlighting certain products will drive the customer towards these products and motivate them to make a purchase [https://en.wikipedia.org/wiki/Visual_merchandising (accessed on 26.12.2016)].
EXTERIOR DISPLAY
Exterior window displays can be used to sell products and entice customers into the store. An eye-catching, innovative window display can promote the brand image. It can be used to advertise. Windows can give consumers and by-passers an understanding as to what goods are sold in store. They are also an effective way of promoting fashion trends and providing useful information to the target audience [https://en.wikipedia.org/wiki/Visual_merchandising (accessed on 26.12.2016)].
Window Display
The display window is accepted as the most important part of the store design because it is the first meeting place the customer has with a brand and it gives passersby a quick impression of the store. A passerby can hold an opinion about the type of merchandise sold inside. The layout of the display windows should not take focus away from the clothes and it should suggest a feeling. Window displays are crucial whether a store is situated in a mall or in a busy street. They are a mix of art, fashion, design, and marketing. They must compel customers to enter a store by defining a brand’s image. Today, retailers are recognizing the importance of window display as the first point of contact between the store and the customer [Yolande Hefer & Michael.C.Cant, 2013].
Window displays are used as an initial attraction to bring customers into a store and are also used as a marketing tool to communicate the brand’s image to the consumers as well as to distinguish itself from its competitors [https://en.wikipedia.org/wiki/Visual_merchandising (accessed on 26.12.2016)].
Merchandise-focused displays convey concrete messages and thus facilitate an understanding of merchandise itself to influence shoppers’ store entry decisions. In contrast, artistic displays convey abstract messages to induce curiosity and further encourage exploration within the store. Successful implementation of such artistic window displays can grab shoppers’ attention, provoke their curiosity and interest, effectively communicate store/brand image, and further draw them into stores to purchase [http://www.simplypsychology.org/likert-scale.html accessed on (31.12.2016)].
Customers give three to five seconds of their attention to the window display. The retailer’s visual message should be conveyed to the customer in that short period of time [Gudonaviciene Rasa & Alijosiene Sonata, 2015] The interpretations of the study conducted by Vinamra Jain, Ashok Sharma, and Pradeep Narwal state that 42% of women are attracted to the eye-catching window display and 44.67% of the women always pay attention to the different window display no matter what is being displayed [Soundariya S., Sathyan S, 2015].
Color
Pegler suggests that people buy color before they buy, size, fit, or price. Colors say something about the kind of merchandise and merchandiser [Yolande Hefer & Michael.C.Cant, 2013]. Color is one of the most powerful tools in the Visual Merchandising segment. It is a visual perceptual property. Colors can be associated with emotions, special occasions, and gender. It attracts attention and pulls more customers into the store. A retailer has to focus on the right choice of color that would match the theme of the display.
It is not possible to satisfy everyone all the time, but it is possible to cultivate the taste of customers gradually and purposefully. The right choice of colors in the display items can turn walkers into stoppers and significantly convert them into customers. A Halloween display would require black color in the display theme. Valentine’s theme should be ruled by red color supplemented with pink and white. A display of baby accessories should reflect light shades of pink and blue colors. A Christmas display should contain colors of red, green, gold, and silver [Gudonaviciene Rasa & Alijosiene Sonata, 2015].
Graphics, Photography, and Signage
The use of graphics and photography in window displays is an effective way of communicating information to the consumer. The most common form of communication in window displays is through text and signage, especially when advertising a sale or a special. This technique is commonly directed towards price-driven customers who are constantly on the lookout for bargains. Photography can be used in a window display to enhance the theme of a window or reinforce the brand’s advertising campaigns [https://en.wikipedia.org/wiki/Visual_merchandising (accessed on 26.12.2016)].
For most businesses, the most cost-effective and efficient form of advertising to potential customers is on-premise signage and is a business’s basic link to customers. The purpose is to promote impulse “stop and shop,” to create awareness for the product or service for future reference and to influence purchasing decisions once the customer has stopped. The objectives of Signage are explained as 1. To assist customers in their flow across the store. 2. To lead the customers in newer sections opened in the store if any 3. Through Color and contrast, add to the visual ambiance of the store [Yolande Hefer & Michael.C.Cant, 2013].
Signage is the “silent salesperson” for the retailer and must reflect the correct brand image. Proper signage has been shown to increase the sale of an item by over 40% [Gudonaviciene Rasa & Alijosiene Sonata, 2015]. There are various types of signage. For instance:
- ‘Promotional’ signage which informs the customer about off-price events or schemes;
- ‘Location’ signage which directs the buyer to specific departments or merchandise;
- ‘Institutional’ signage which gives information on store policies, charitable events, etc., and
- ‘Informational’ signage provides product-related information like special features, benefits, sizes, price, etc.[ Gudonaviciene Rasa & Alijosiene Sonata, 2015]
Seasonal Displays
Adjusting window displays based on seasonal events, calendar dates, and consumerism-based holidays such as Christmas, Valentine’s Day, and Father’s Day can be a useful approach to encourage consumer purchasing. Choosing products that suit the season to display in the window can remind consumers to purchase gifts and provide gift ideas for the particular holiday [https://en.wikipedia.org/wiki/Visual_merchandising (accessed on 26.12.2016)].
CUSTOMER BUYING PROCESS
Visual merchandising has a great role by converting passersby to spenders and ultimately converting them to loyal customers. According to the customer stickiness progression, model loyal shoppers will become spenders who contribute more to the profit of the organization [Soundariya S., Sathyan S, 2015]. Stopping Power – If displays are built full of familiar items, the chances are that the customers will not stop and have a look. The familiar products must be displayed with the unfamiliar, not only will they stop and look, the chances are they are more likely to purchase the familiar items.[ Jain Vinamra, Sharma Ashok, Narwal Pradeep, January 2012].
CONSUMER BEHAVIOUR
Consumer behavior can be defined as the study of individuals, groups, or organizations and the processes they use to select, secure, use and dispose of products, services, experiences, or ideas to satisfy needs and the impact that these processes have on the consumer and society. Consumer behavior also includes the consumers’ expressive, psychological and social responses that lead, establish or follow these responses [Yolande Hefer & Michael.C.Cant, 2013]. A typical consumer behavior model is depicted in Figure 1.
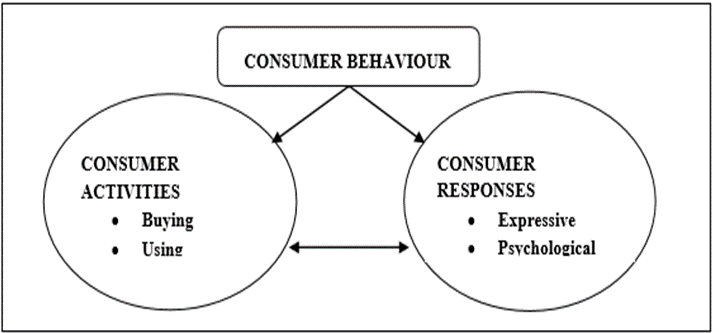
Sources: Adapted from Kardes, F. R., Cline, T. W. & Cronley, M. L. (2011). Consumer Behaviour: Science And Practice. China: South-Western, p.8.
The figure indicates that consumer behavior consists of consumer activities and consumer responses, that both influence each other. Therefore, a consumer’s expressive, psychological and social responses will have an influence on their buying, using, and disposing activities, and vice versa. An expressive response reveals a consumer’s passions, feelings, and frame of mind. The psychological responses consist of a consumer’s thought processes, judgments, attitudes, and values and could include a consumer’s feeling toward a specific apparel retail store [Yolande Hefer & Michael.C.Cant, 2013].
IMPULSE BUYING
Impulse buying refers to unplanned, sudden buying behavior, which is often accompanied by a feeling of excitement and pleasure and/or a powerful urge to buy [Gudonaviciene Rasa & Alijosiene Sonata, 2015]. “All impulse buying is at least unplanned, but all unplanned purchases are not necessarily decided impulsively.” [Laurent Hubrechts & Beyhan kokturk, 2012]. Surveys have shown that impulse buying makes up 27-62 percent of the total buying at shopping centers [Gudonaviciene Rasa & Alijosiene Sonata, 2015]. Impulse buying is subdivided into four categories :
- Pure impulsive buying – Refers to a purchase that cannot be categorized in the planned purchasing at all. This is a purely spontaneous way to buy is strongly linked to emotional factors.
- Suggestion impulsive buying – Which is a need triggered by the encountering of a new product for the first time, that can only be fulfilled by getting it.
- Reminder impulsive buying – e. an item that remembers the consumer he/she needs it as soon as he/she sees it. Unlike suggestion impulsive buying, the consumer has knowledge about the product when it comes to reminder impulsive buying, but it is still considered as an impulse purchase.
- Planned impulsive buying – This paradoxical category can be explained by the fact that when the impulsive buyer goes into a store with the intention to buy a specific item. e.g. clothes, but the choice about the specific item, brand, size, and the price hasn’t been decided before. The purchasing decision is made at the point of sale.
This last category can be seen as the boundary between planned and unplanned buying [Laurent Hubrechts & Beyhan kokturk, 2012]. The purchasing process starts with need recognition – the buyer recognizes a need. This recognized need can be triggered by internal or external stimuli. Once the need is identified, the consumer will start seeking information. At this level, the consumer will process the information and may take the buying process to the next level, which is the purchase decision. Finally, he will assess his satisfaction or dissatisfaction toward the purchased product. This final step is crucial for the store because a satisfied customer may develop loyalty towards the store where he bought the item. The process will start over, as the consumer needs another product [Laurent Hubrechts & Beyhan kokturk, 2012].
No systematic study is reported on the impact of visual merchandising on the impulse buying behavior of consumers in the Coimbatore region in India. Thus, we thought it worthwhile to investigate the impact of visual merchandising on impulse buying behavior of consumers in the Coimbatore region in India, the relationship between the impulse buying behavior (Dependent variable) and each of the four visual merchandising techniques i.e. window displays, store interior, mannequin display and signage (Independent Variables) and the factor among the four techniques greatly influences the consumers impulse buying behavior.
METHODOLOGY
The nature of the research approach chosen was explanatory since this method is used to determine the effect that a variable has on another (cause and effect relationship). The method included a survey containing close-ended questions since it allows the respondent to choose from among a given set of responses and the results obtained will be easier to analyze.
Questions were developed and adopted from the literature review. The questionnaire is made up of six major categories. The first category consisted of questions to determine the respondents’ demographic profile, such as name, age, gender, occupation, and income.
The second category contains six questions that measure the customers’ impulse buying tendencies.
The other four categories similarly have six questions each which determine the customers’ buying behavior towards the four visual merchandising practices such as window display, store interior, mannequin display, and signage.
The survey was administered using a structured questionnaire among 100 people in Fun Republic Mall, Coimbatore, and in Bannari Amman Institute of Technology, Sathyamangalam. Out of the 100 respondents, 42 were male and 58 were female in the age group of 18 to 30. Respondents were asked to select the choice that best characterized their answer. A five-point Likert scale ranging from strongly disagree =1 to strongly agree = 5 was used to measure each variable.
To study the impact of visual merchandising on buying behavior of consumers, the dependent variable consumer is young consumer’s impulse buying tendency and the independent variables of the study are the techniques of visual merchandising. The independent variables of the study are window displays, store interior, mannequin display, and signage. Those four types of visual merchandising will influence young consumers’ impulse buying behavior [Sahni Deepak, Jain Vipul, Jain Arvind, 2014].
The SYSTAT software package was used to analyze data collected from the survey. Principal component analysis, Factor analysis, Reliability test, Pearson Correlation coefficient, and Regression analysis were carried out.
Following research hypotheses were developed from the dimensions found in the literature review of visual merchandising.
- H1: The window display influences the customers to engage in impulse buying.
- H2: Store interior influences the customers to engage in impulse buying.
- H3: Mannequin display influences the customers to engage in impulse buying.
- H4: Signage influences the customers to engage in impulse buying.
Their relation in terms of visual merchandising in terms of impulse buying behavior is to be found out. The dependent variable of the study is impulse buying and independent variables are window display, store interior, mannequin display, and signage. These variables have individual constructs which are tested on a five-point Likert scale which ranged from strongly disagree = 1 to Strongly agree = 5.
RESULTS AND DISCUSSIONS
The outline for analysis is as follows: First, descriptive statistics are generated. Then, Principal Component Analysis for data reduction and reliability tests are conducted. The Pearson Correlation test is conducted to check the correlations between impulse buying tendency and each of the four types of visual merchandising practices. Finally, Linear Regression Analysis is conducted for hypothesis testing to find out the relationships between impulse buying tendency and each of the four types of visual merchandising practices.
RELIABILITY TEST
The questionnaire for the work has been tested with a reliability statistical test and is shown in Table 1. Statistically, the values of Cronbach Alpha which is more than 0.5 are considered reliable. So the questionnaire is very reliable with a value of 0.834.
Table 1 – Reliability Test
| Cronbach’s Alpha | N of Items |
| 0.834 | 30 |
FACTOR ANALYSIS
Factor analysis is a data reduction technique for identifying the internal structure of a set of variables. Eigenvalues measure the amount of the variation explained by each principal component (PC). The component matrix is shown in Table 2 and the factorized matrix is indicated in Table 3.
Table 2 Component Matrix
| Component | ||||||||||||
|---|---|---|---|---|---|---|---|---|---|---|---|---|
| 1 | 2 | 3 | 4 | 5 | 6 | 7 | 8 | 9 | 10 | 11 | ||
| 1. | I often buy things without thinking | .248 | .272 | .515 | .095 | .163 | .007 | -.074 | -.476 | -.019 | -.164 | .012 |
| 2. | I tend to purchase unintended products while trying to find a specific product | .331 | .119 | .534 | .190 | .074 | .369 | .024 | -.198 | .096 | -.028 | .025 |
| 3 | I feel a sense of excitement when I make an impulse purchase | -.007 | -.254 | .574 | .156 | -.058 | .073 | .334 | .048 | .107 | -.105 | .064 |
| 4 | After I make an impulse purchase I feel regret | .428 | -.206 | -.001 | .312 | -.025 | .078 | -.524 | -.097 | -.110 | -.170 | .122 |
| 5 | I have difficulty controlling my urge to buy when I see a good offer | .374 | -.277 | .275 | .137 | .019 | -.192 | .074 | .443 | -.222 | .076 | .099 |
| 6 | when I see a good deal, I tend to buy more than I intended to buy | .318 | -.369 | .264 | -.187 | .182 | .151 | .343 | .182 | -.265 | .105 | .266 |
| 7 | While browsing the store I tend to purchase products displayed in eye-catching displays | .463 | .336 | -.060 | .230 | .161 | -.316 | -.327 | .321 | -.005 | .027 | -.055 |
| 8 | Window display attracts me to a brand or product I hadn’t previously considered purchasing before entering a store | -.280 | .502 | .348 | -.026 | -.089 | .045 | -.152 | .154 | -.046 | -.328 | .298 |
| 9 | The window display is the most influencing feature driving me into the store | .321 | .526 | .122 | .169 | -.152 | .313 | .163 | .078 | -.094 | -.112 | -.079 |
| 10 | I tend to choose which store to shop in depending on eye-catching window displays | .429 | .573 | -.225 | .050 | -.052 | -.006 | .095 | .252 | -.075 | -.160 | .072 |
| 11 | I choose to enter a store because of the attractive window display | .421 | .524 | .017 | .177 | -.186 | .171 | .014 | .095 | .046 | .063 | .299 |
| 12 | If the item I like appears in the window display, my desire of buying it will be stimulated | -.231 | .525 | -.198 | -.086 | .186 | .054 | -.041 | .183 | -.035 | -.232 | -.453 |
| 13 | I tend to buy products displayed at or near the checkout desks | .115 | .178 | .142 | -.236 | .584 | .151 | -.196 | .194 | .189 | .400 | .125 |
| 14 | I tend to buy products displayed on shelves on sight | .449 | -.068 | .288 | -.173 | .264 | .013 | .061 | -.126 | .575 | .003 | -.061 |
| 15 | I choose to shop in an outlet with a good layout, moving/browsing space & ambiance | .076 | .112 | -.387 | .456 | .315 | .443 | -.026 | .107 | .123 | .144 | .069 |
| 16 | In-store lighting, music, and scent enhances my shopping experience | .464 | -.516 | .050 | .322 | .166 | -.157 | -.118 | -.045 | .251 | .037 | -.060 |
| 17 | In-store merchandise and mannequin display promotes impulse buying | .484 | .044 | -.496 | .024 | .120 | .297 | .388 | -.024 | -.027 | .061 | -.096 |
| 18 | In-store communication elements like banners, graphics enhance merchandise display & affect the customer purchase decision | .482 | -.321 | -.040 | -.286 | .156 | .121 | .136 | -.410 | -.249 | .034 | -.011 |
| 19 | Mannequin display helps me compare products I am considering buying | .372 | -.023 | -.457 | -.360 | -.043 | -.032 | .058 | .020 | .313 | .020 | .250 |
| 20 | I get an idea of what I want to buy after looking through the mannequin display | .465 | -.065 | .048 | .226 | .189 | -.524 | .219 | .071 | -.174 | .209 | .059 |
| 21 | Mannequin display helps to know about the current fashion trend & influences my purchase decision | .385 | -.264 | -.198 | .447 | .086 | -.191 | .249 | -.312 | -.107 | -.059 | -.126 |
| 22 | Mannequins are very visual & help consumers help visualize how the clothing will look on | .228 | -.192 | -.106 | .132 | -.494 | -.167 | .207 | -.168 | .396 | .103 | .245 |
| 23 | I get attracted to mannequins that are in different poses and styles | .452 | .249 | .035 | .138 | -.458 | -.030 | -.129 | -.012 | .047 | .093 | -.262 |
| 24 | I tend to buy the clothing as well as the accessories that are worn by the mannequin | .292 | .498 | .394 | -.084 | -.030 | -.306 | .269 | -.026 | .124 | .030 | .041 |
| 25 | I am more likely to buy an unintended product that is on discounts & offers | .480 | .302 | .209 | -.223 | .115 | -.153 | .014 | -.234 | -.197 | .210 | -.295 |
| 26 | I tend to stop and browse products with promotional offers | .497 | -.184 | -.106 | -.184 | -.045 | .067 | -.413 | -.284 | -.222 | .008 | .319 |
| 27 | Products with promotional signs such as offers, discounts are the most noticed ones inside a store | .522 | .063 | -.351 | -.226 | -.149 | -.255 | -.211 | -.135 | -.035 | .346 | .087 |
| 28 | Exterior store signage, graphics & promotional offerings compel me to enter a store | .748 | -.007 | -.155 | -.155 | -.025 | .080 | -.245 | .084 | .088 | -.020 | -.195 |
| 29 | Signage increases my awareness towards highlighted products & helps me in purchasing decisions | .400 | .056 | .044 | -.344 | -.367 | .267 | .075 | .122 | -.237 | .157 | -.072 |
| 30 | The more information I have got about a product, the more likely I will buy it | .260 | .072 | -.091 | -.454 | .127 | -.195 | .053 | .129 | .150 | -.579 | -.007 |
Extraction Method: Principal Component Analysis.
a. 11 components extracted.
Table 3: Factorised Matrix
| 1 | 2 | 3 | |
| SIGNAGE :
Exterior store signage, graphics & promotional offerings compel me to enter a store |
0.748 | ||
| Products with promotional signs such as offers, discounts are the most noticed ones inside a store | 0.522 | ||
| WINDOW DISPLAY :
I tend to choose which store to shop in depending on eye-catching window displays |
0.573 | ||
| The window display is the most influencing feature driving me into the store | 0.526 | ||
| I choose to enter a store because of the attractive window display | 0.524 | ||
| If the item I like appears in the window display, my desire of buying it will be stimulated | 0.525 | ||
| Window display attracts me to a brand or product I hadn’t previously considered purchasing before entering a store | 0.502 | ||
| IMPULSE BUYING :
I tend to purchase unintended products while trying to find a specific product |
0.534 | ||
| I often buy things without thinking | 0.515 | ||
| I feel a sense of excitement when I make an impulse purchase | 0.574 |
Factor 1 is named as “Signage”
Factor 2 is named “Window Display”
Factor 3 is named “Impulse Buying”
As the dependent variable ( Impulse buying ) should not be considered in factor analysis, it is excluded from the result.
CORRELATION AND REGRESSION ANALYSIS
Pearson correlation test was conducted to see the correlations between the dependent variable (impulse buying) and independent variables (Table 4). In addition, linear regression analysis was conducted for the hypothesis testing using impulse buying tendency as a dependent variable and each visual merchandising variable (Table 5).
Table 4: Pearson Correlation with Impulse Buying
| Variables | Pearson Coefficient | Significance |
| Window Display | 0.331 | 0.001 |
| Store Interior | 0.459 | 0.000 |
| Mannequin Display | 0.319 | 0.001 |
| Signage | 0.304 | 0.002 |
Table 5 : Hypothesis and R Square Coefficient From Regression Analysis
| Hypothesis | R Squared value | Tolerance | p-Value | Conclusion |
| H1 | 0.109 | 1.000 | 0.001 | Impulse buying behavior of customers and window display are directly related. |
| H2 | 0.211 | 1.000 | 0.000 | Impulse buying behavior of customers and Store Interior are directly related. |
| H3 | 0.102 | 1.000 | 0.001 | Impulse buying behavior of customers and Mannequin Display are directly related. |
| H4 | 0.093 | 1.000 | 0.002 | Impulse buying behavior of customers and Signage are directly related. |
H1: Hypothesis 1 is aimed to discover whether there is a significant relationship, the correlation between customers’ impulse buying behavior and window display.
According to the Pearson correlation test (Table 4), a significant correlation (r = 0.331) was found between impulse buying and window display with a p-value of 0.001 (“Significance (p)” in Table 4), which is less than 0.05, i.e. the null hypothesis is rejected and the alternative hypothesis is accepted. Since the p-value is less than 0.05, it is evident that there is a direct relationship between them. Although window display and impulse buying behavior are directly related, the regression analysis showed that window display had comparatively weak significance on customers’ impulse buying behavior with an R squared value of 0.109.
H2: Hypothesis 2 is framed to determine whether there is a significant relationship, the correlation between customers’ impulse buying behavior and store interior and if this visual merchandising technique enhanced this behavior.
The Pearson correlation test (Table 4) showed a significant correlation (r = 0.459) between impulse buying and store interior with a p-value of 0.000 (“Significance (p)” in Table 4), which is less than 0.05, i.e. the null hypothesis is rejected and the alternative hypothesis is accepted. Since the p-value is less than 0.05, it is evident that there is a direct relationship between them.
From the regression analysis, it is found that the result of the R square coefficient test showed a much higher coefficient (0.211) for the relationship between customers impulse buying behavior and store interior than that of the relationship between customers impulse buying behavior and window display (0.109) or mannequin display (0.102) or signage (0.093). This result suggests that store interior has much higher significance and it strongly influences the customers’ impulse buying behavior (Highest among all).
H3: Hypothesis 2 is designed to discover whether there is a significant relationship, the correlation between customers’ impulse buying behavior and mannequin display.
From the Pearson correlation test (Table 4), a significant correlation (r = 0.319) was found between impulse buying and mannequin display with a p-value of 0.001 (“Significance (p)” in Table 4), which is less than 0.05, i.e. the null hypothesis is rejected and the alternative hypothesis is accepted. There is a direct relationship between the customers’ impulse buying behavior and mannequin display since the p-value is less than 0.05.
Even though there is a direct relationship between mannequin display and impulse buying behavior, the regression analysis proved that mannequin display also has weak significance on customers’ impulse buying behavior with an R squared value of 0.102.
H4: Hypothesis 1 is aimed to discover whether there is a significant relationship, correlation between customers’ impulse buying behavior and signage.
The Pearson correlation test (Table 4) showed a significant correlation (r = 0.459) between impulse buying and signage with a p-value of 0.002 (“Significance (p)” in Table 4), which is less than 0.05, i.e. the null hypothesis is rejected and the alternative hypothesis is accepted. Since the p-value is less than 0.05, it is evident that there is a direct relationship between them.
From the regression analysis, it is found that the result of the R square coefficient test has a much smaller coefficient (0.093) for the relationship between customers impulse buying behavior and signage than that of the relationship between customers impulse buying behavior and window display (0.109) or mannequin display (0.102). This result suggests that signage has much weaker significance on customers’ impulse buying behavior with an R squared value of 0.093 (Weakest among all)
CONCLUSION
Since impulse buying is an influencing aspect of consumers’ behavior, finding the variables that influence those behaviors is important for retailers in order to survive in the competitive marketplace. It is corroborated from the study that all the four elements of visual merchandising i.e.
1) Window display
2) Store interior
3) Mannequin display and
4) Signage significantly
influence the consumer’s impulse buying behavior. From the factor analysis, it is inferred that signage and window display of the store has the highest impact on consumers’ buying behavior. From the Pearson correlation and regression analysis, it is found that all those elements taken for the study have a positive impact on the consumers’ impulse buying behavior.
Among all the four elements, the store interior has the highest significance. This indicates that this visual merchandising practice acts as an external motivator creating a desire to make unplanned purchases which significantly influences impulse buying behavior. The results suggest that the retailers must concentrate more on store interior to improve the impulse buying behavior of consumers and thereby increase the sales of the store. The factors such as store layout, store design, point of purchase displays, item display, assortment display, and signage contribute to the overall store interior. If these are applied successfully to a store, the retailers can meet the needs of the consumer and provide a positive impact on sales of the merchandise.
BIBLIOGRAPHY
- Kaur Amandeep, (2013), Effect of Visual Merchandising on Buying Behavior of Customers in Chandigarh. International Journal of Engineering Science and Innovative Technology (IJESIT) Volume 2, Issue 3.
- Sahni Deepak, Jain Vipul, Jain Arvind, (2014), The Impact Of Visual Merchandising On Impulsive Buying Behavior Of Young Consumers. Asian Journal of Business and Economics Volume 4, No.4.4 Quarter IV.
- Emory, C. W., & Cooper, R. D. (1991). Business Research Methods (4th ed.). Boston, MA: Irwin.
- http://blog.minitab.com/blog/adventures-in-statistics/regression-analysis-how-do-i-interpret-r-squared-and-assess-the-goodness-of-fit [accessed on 21.12.2016]
- https://en.wikipedia.org/wiki/Likert_scale [accessed on 21.12.2016]
- https://en.wikipedia.org/wiki/Pearson_correlation_coefficient [accessed on 22.12.2016]
- https://en.wikipedia.org/wiki/Reliability_(statistics) [accessed on 24.12.2016]
- https://en.wikipedia.org/wiki/Visual_merchandising [accessed on 26.12.2016]
- http://research-methodology.net/research-methodology/research-design/conclusive-research/causal-research/[accessed on 28.12.2016]
- http://www.public.asu.edu/~kroel/www500/HYPOTHESIS%20Fri.pdf [accessed on 29.12.2016]
- http://www.simplypsychology.org/likert-scale.html [accessed on 31.12.2016]
- Hyunjoo Oh, JennyPetrie, (2012), How do storefront window displays influence entering decisions of clothing stores? Journal of Retailing and Consumer Services, 19, p 27–35.
- Laurent Hubrechts & Beyhan kokturk, (2012), Effect of visual merchandising on young consumers’ impulse buying behavior, hh.se. [ accessed on 30.12.2016].
- Marta Gigola, (2013), Impact of Visual Merchandising on Consumers’ Behaviour while Buying Apparels, Konsumpcja i Rozwój 2(7), p73-83.
- Neha P. Mehta*, Pawan K. Chugan, (2013), The Impact of Visual Merchandising on Impulse Buying Behavior of Consumer: A Case from Central Mall of Ahmedabad India. Universal Journal of Management, 1(2), p 76-82.
- Rao Rama, Mopidevi, Lolla Sree Rama, (2013), Visual merchandising an impulsive reinforcer of purchases leading to social imbalance: a case study on middle class families in Hyderabad. IOSR Journal of Business and Management 9, Issue 6, PP 111-122.
- Gudonaviciene Rasa & Alijosiene Sonata, (2015), Visual Merchandising Impact on Impulse Buying Behaviour, 20th International Scientific Conference Economics and Management.
- Madhavi S. and Leelavati T.S., (2013), Impact of Visual Merchandising on Consumer Behavior Towards Women Apparel. International Journal of Marketing Research and Business Strategy, 2, No. 4.
- Soundariya S., Sathyan S, (2015), Visual Merchandising and its Impact on Customer Buying Decisions. Indian Journal Of Applied Research, 5.
- Jain Vinamra, Sharma Ashok, Narwal Pradeep, (January 2012), Impact of Visual Merchandising on Consumer Behaviour towards Women’s Apparel, International Journal of Research in Marketing,
- Goud G Virupaksha & Kumar P Pradeep, (2016), A Study On Impact Of Visual Merchandising On Customer Buying Intention At Fashion Retail Shops In Bangalore. Asia Pacific Journal of Research, I.
- statstutor.ac.uk/resources/uploaded/pearsons.pd [accessed on 01.02.2017].
- Yolande Hefer & Michael.C.Cant, (2013), Visual Merchandising Displays’ Effect On Consumers: A Valuable Asset Or An Unnecessary Burden For Apparel Retailers, International Business & Economics Research Journal, 12.
- Zeynep Taskıran, (2012), The Elements of Visual Merchandising. IZMIR University Of Economics, Faculty Of Fine Arts And Design Department Of Visual Communication Design, Gd 494.


Good sign manufacturing can mean the difference between a sign that lasts a season and one that lasts a decade. Everything from the paint finish to how it’s sealed against moisture plays a role. I’ve seen businesses invest in a beautiful design only to cut corners in manufacturing, which leads to fading, rust, or electrical issues way too soon.