
One of the biggest challenges in the apparel segment is that the countries like UK, US, Europe have their sizing system but India still doesn’t have it. The purpose of the study is to identify the need for a sizing system for India. This research paper shows the lack of an accurate and standardized sizing system for readymade garments in India. Every brand in India follows its sizing chart which is based on the international sizing chart of readymade garments. Since our Indian body shapes are different from the international figures, international sizing systems-based garments fail to fulfil the need of our Indian customers.
Each brand has its understanding regarding Indian build and they create variation in the sizes according to their interpretation hence there are inconsistencies in sizes between brands which makes it difficult for the consumer to get their right fit and creates confusion regarding their right size. Consumers are forced to have alternations done every time they purchase cloth or else wear ill-fitting clothing. Research shows that the unavailability of a correct and standardized sizing system, targeting Indian people is a major issue.
Introduction
The sizing system is a numerical table that represents the number of key values used to classify the bodies encountered in the population. An anthropometric data-based measurement system (human measurement) is known as an anthropometric sizing system. Research into anthropometric sizing systems has been comprehensively done around the world for efficiency in apparel manufacturing. The structure of the sizing system is based on the division of targeted people into groups with similar body measurements.
Researchers in the field of clothing have long recognized the need for consistent and standard sizes for the varied population. Such a program aims to provide each individual with the appropriate balance of clothing. In addition, people in each size group are considered to have similar physical features and therefore can share the same size of clothing.
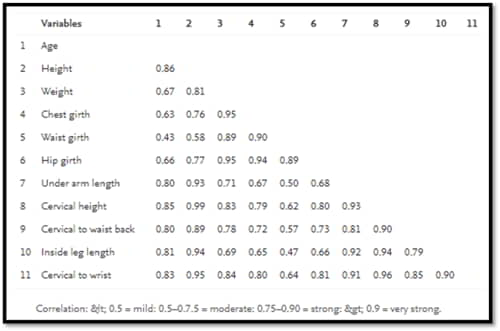
To develop a good measurement system, key sizes should take one measurement from a horizontal body size set (e.g., belt) and a set of precise body sizes (e.g., length or length).
Since the beginning of the dress code in the mid-1900s, there has been a need for definitions of clothing that differentiate body shape and size into different categories. This requires a systematic and scientific system for measuring and classifying human bodies, which is the purpose of creating a clothing scale. In addition, a good measurement system that leads to appropriate clothing should be based on anthropometric data. Clothing balance is defined as clothing with the right size and size. Having said that, the definition of clothing equality includes two items of size and shape. To get the right fit, you need to choose a dress that is the right size and shape. Sizes are based on the measurements of the human body. In addition, body composition is made by the depth, width, and length of the body.
The purpose of creating a bodybuilding program is to find a large number of size groups that will determine the shape and size of the most encountered people and to accommodate as many people in each situation and group as possible with the source – Clothing worn while allowing the manufacturer to make a profit.
Traditional measurement system
No two people have ever been alike in all of their measurable aspects. This difference has been a matter of curiosity and research for over 200 years. In the past, different people were more likely to express their limited body image. This method is called anthropometry. Anthropometry describes the size of a human body. The name is derived from Anthropos, meaning a person, and metrics, meaning or related to the equation.
It was not until the 1950s that anthropometrics became a popular discipline. Anthropometry usage settings include cars, workplaces, equipment, aeroplane cockpits, and clothing. For years, anthropometry has been used in national research as a measure of health status. Step-by-step testing has been the subject of research for a long time.
Reliability is defined as the degree to which a measure can be recovered over time. Reliability of scale has elements of accuracy and reliability. In both cases, accuracy is more important than reliability. However, issues of fidelity are often overlooked in problem-oriented research because of the impact of measurement error. Viewer error is the most troublesome source of anthropometric error. It includes ambiguity in the notable area, setting the title, and the use of the instrument. This error can be emphasized by the use of multiple observers even if they are trained by the same person and work collaboratively. Error limits are usually set before data collection while measurement performance is considered throughout the process against pre-set standards. Viewing errors in anthropometry are unplanned and uncommon. Therefore, traditional methods of measurement bodies need to be significantly improved.
Ancient anthropometric data provides details on the static size of the human body in a typical position. The science of anthropometry is one of the most accurate. Experienced workers in the field are best able to use this method. Most of the measurements taken from the article are considered to be in the most desirable position. Measurements are measured, if possible, in the morning. The human body usually loses its height during the day and is usually more relaxed in the morning. It is best if the subject is not fully clothed or has as little clothing as possible.
The traditional method of measurement
In most cases, the body of the title is placed in a fixed vertical position, the body parts being about 180, 0, or 90 degrees to each other. For example, a title may need to be “straight; heels together; buttocks, shoulder blades, and back of the head touching the wall; arms straight, fingers straight…”: This is close to the so-called “anatomical position” used in anatomy. The head is placed on “Frankfurt Flight”; Pupils are at the same level of horizontal, right traction (thought of ear piercing), and the lowest point of the right orbit (eye socket) is also placed in the same horizontal plane. When taking steps on a sitting head, the area (flat and straight) of the seat and foot support is arranged in such a way that the thighs are straight, the legs are straight and the feet are flat on their horizontal support. The subject is naked, however, and not clean.
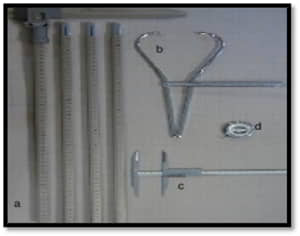
Instruments have been used since Richer began using weapons in 1890. Simple, fast, non-invasive tools include a weight scale, a camera, a measuring tape, an anthropometer, a scattering calliper, a navigation compass, and a head panel.

3D Scanning Measurement System
Even after basic training, it is difficult for the average retailer to come up with specific rates. This is where 3D technology proves to be a blessing. The development of three-dimensional body scanning technologies has great potential for use in the clothing industry, especially to create custom or quantity techniques to be used.
3D body scanning is a technology that produces a 3D model by scanning. A man stands given the scanner while taking a picture of his body and producing 3D images in seconds. The scanner uses a series of light sensors to produce a 3D image. Images are taken in 360 degrees within a short time as well as body measurements and the human body image. This data is archived or processed according to need.
3D body scans and computer-generated images are used to customize many outfits, in which the consumer is measured in size, and with a computer-generated image displayed on a computer screen, he can choose a dress that suits his or her wishes.
Three-body scanning technologies are used in a variety of fields. A popular application for this scanning process is in the field of customization. People come in many shapes and sizes. This has created an equality problem. Manufacturers needed precise details to produce suitable clothing. Customizing clothes to fit well with the consumer depends on the availability of complete measurements. Advances in the field of Information Technology assists retailers and manufacturers with the 3D Body Scanning process. In this process, individual measurements can be obtained accurately and quickly. 3D scanned data contains standard measurements such as chest size, body size, circle, and complete 3-D data for each individual. These new technologies are changing the characteristics of the clothing industry.
NIFT LAUNCHES STANDARD SIZE INITIATIVE
The National Institute of Fashion Technology (NIFT) has launched a national study to measure the size of the development of the first chart for India, which will provide Indians with better clothing.
Mapping research will include basic data such as gender, location and age. The first phase of the study will look at a size chart for 15–65-year-olds, and the second phase will look at the size of the children, as well as the shoes. The whole scan process will take approximately 15 minutes for each scan.
Indian Size Project will use three 3D body scanners in NIFT – New Delhi (North), Mumbai (West), Kolkata (East), Hyderabad (Centre), Bengaluru (South) and Shillong (North East), for ceremonial and rural areas. combined. These human-powered scanners are enabled to extract fully 3D body maps in less than 10 seconds, thus reducing the amount of time required to perform anthropometric research.
The details will be treated as assets of the Ministry of Textiles. It will need to be reviewed after 10 years, although further research can be done at a much smaller scale.

LITERATURE SURVEY
In the most general terms, the purpose of an apparel sizing system is to divide a varied population into homogeneous subgroups. Members of a subgroup are similar to each other in body size and shape so that a single garment can adequately fit each of them. Members of different subgroups are dissimilar and would therefore require different garments (McCulloch, Paal & Ashdown, 1996).
Due to the lack of Indian sizing surveys, retailers/manufacturers are forced to use the size charts of other countries i.e. the US and/or the UK where the anthropometric make of the population is very different from that of India.
The knowledge of anthropometric dimensions is necessary for the development of garment patterns. In countries like India, where retailing is expected to see unprecedented growth in the next few years, the success or failure of a brand depends on the fit of clothing that is offered to consumers (Deepti Gupta, 2010).
Appavoo & Jeyasingh (2012) proposed a new approach of a two-stage data mining procedure for labelling the shirt types exclusively for Indian men. In the first stage, the clustering technique was applied to the original dataset, to categorise the size labels. Then these clusters are used for supervised learning in the second stage for classification
The anthropometric data collected and analysed will be used to develop comprehensive bottom-wear body size charts for Indian male youth. The body size charts maybe used by mass manufacturers of bottom-wears. It is recommended that to include people of other age groups, genders and product categories as an extension of this research Manoj Tiwari& Noopur Anand (2019) used anthropometric data to develop comprehensive bottom-wear body size charts for Indian male youth.
Kausher& Srivastava (2019) collected anthropometric data of females between the ages of 16 to 80 years from some states of India to produce the sizing system suitable for clothing manufacture and retailing. Factor analysis technique was used to filter the control body dimensions from a large number of variables. Decision tree-based data mining was used to cluster the data.
Throughout the literature, there have been consistent efforts to develop an Indian sizing system by using several different methodologies. However, researchers did not include people of all age groups and gender. As we know, the body shapes within the country are not the same, so people from every region of India should be included in the proper sizing system of all body types.
RESEARCH DESIGN
The research design is developed to provide an acceptable framework for the study. The choice to be made regarding the research method is a very significant decision in the research design process since it determines how relevant information can be gathered for a study.
The following decisions were made while conducting this study:
Sample Design
| Universe | Population of India |
| Measuring tool | Questionnaire |
| Sampling Method | Convenience sampling |
| Sample Size | 165 |
| Data Analysis Method | Tables, Graphs and Descriptive Statistics |
| Hypothesis Testing Tools | 1. Chi square Goodness of Fit
2. Z test for Proportion, 3. One Way Anova, 4. Pearson Correlation Coefficient, 5. Fisher’s Exact Method. |
Data collection
Data collecting is an important approach of research design and it helps in collecting relevant information with the help of which the researcher can predict, analyze, and evaluate different outcomes.
The data collection in this particular study includes the following two types of data:
- Primary Data: Questionnaire
- Secondary Data: Similar studies, articles, journals, and research papers.
TOOLS FOR HYPOTHESES TESTING AND DATA ANALYSIS
- A google form has been made to develop the questionnaire and collect the responses.
- Chi-square goodness of fit test – Chi-Square goodness of fit test is a non-parametric test that is used to find out how the observed value of a given phenomenon is significantly different from the expected value. In Chi-Square goodness of fit test, the term goodness of fit is used to compare the observed sample distribution with the expected probability distribution.
- Z test for proportion – This test for a difference in proportions. Z-test allows you to compare two proportions to see if they are the same. The null hypothesis (H0) for the test is that the proportions are the same while the alternate hypothesis (H1) is that the proportions are not the same.
- One-way Anova – The one-way ANOVA compares the means between the groups you are interested in and determines whether any of those means are statistically significantly different from each other.
- Pearson’s Correlation Coefficient – The Pearson product-moment correlation coefficient (or Pearson correlation coefficient, for short) is a measure of the strength of a linear association between two variables and is denoted by r. Basically, a Pearson product-moment correlation attempts to draw a line of best fit through the data of two variables, and the Pearson correlation coefficient, r, indicates how far away all these data points are to this line of best fit.
- Fisher’s Exact Method test – Fisher’s exact test examines the relationship between the two dimensions of the table (classification into rows vs. classification into columns). The null hypothesis is that these two classifications are not different.
DATA ANALYSIS AND INTERPRETATION
| TOTAL NUMBER OF RESPONDENTS | 165 |
Data breakdown of the survey on different parameters:
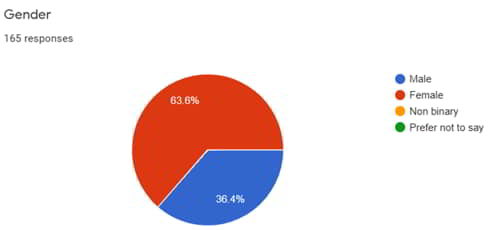
| Break-up category | Category Item | Participants | Category-wise Participants Total |
| Gender-wise | Male | 60 | 165 |
| Female | 105 | ||
| Non-binary | 0 | ||
| Prefer not to say | 0 | ||
| Age-wise | 18-24 | 149 | 165 |
| 25-34 | 12 | ||
| 35-48 | 4 | ||
| 48 & above | 0 | ||
| Demographics-wise | North | 108 | 165 |
| South | 6 | ||
| East | 45 | ||
| West | 6 | ||
| Occupation-wise | Student | 141 | 165 |
| Data Analyst | 1 | ||
| Cyber admin | 1 | ||
| Doctor | 2 | ||
| Banking Professional | 1 | ||
| Education and Teaching | 4 | ||
| Engineering | 4 | ||
| Government Service | 8 | ||
| Private Service | 1 | ||
| Music Producer | 1 | ||
| UX Designer | 1 | ||
| Awareness about the Indian Sizing system | Yes (Aware) | 107 | 165 |
| No (Not aware) | 58 |
FREQUENCY OF RESPONDENTS BUYING NEW CLOTHES
| Category of Clothes | 1Month | 3 to 3 Months | More than 6 Months | 9-10 Months | After 12 Months | Total |
| Formals | 3 | 23 | 41 | 30 | 68 | 165 |
| Jackets | 1 | 8 | 31 | 43 | 82 | 165 |
| Denim Jeans | 4 | 40 | 47 | 38 | 36 | 165 |
| Casual Wear | 49 | 70 | 30 | 12 | 4 | 165 |
| Party Wear | 8 | 42 | 39 | 36 | 40 | 165 |
CHANNELS THROUGH WHICH RESPONDENTS BOUGHT CLOTHES
| CHANNELS | RESPONDENTS |
| Online | 108 |
| In – Store | 6 |
| Custom Made | 45 |
| Total | 165 |
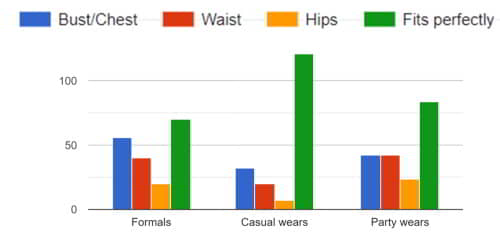
RESPONDENT EXPERIENCES IN TERMS OF COMFORTNESS WITH THEIR CLOTHING ARTICLES
| Type of Clothes | Bust/Chest | Waist | Hips | Fits Perfectly | Total |
| Formals | 56 | 40 | 20 | 70 | 165 |
| Jackets | 35 | 13 | 9 | 116 | 165 |
| Denim Jeans | 0 | 58 | 31 | 88 | 165 |
| Casual Wear | 32 | 20 | 7 | 106 | 165 |
| Party Wear | 42 | 42 | 24 | 84 | 165 |
RESPONDENTS VIEWS ON UNIVERSAL SIZING SYSTEM
| RESPONSE | RESPONDENTS |
| Uncomfortable | 13 |
| Somewhat Comfortable | 82 |
| Comfortable | 55 |
| Extremely
Comfortable |
12 |
RESPONDENTS VIEWS ON INDIA NEEDING ITS OWN SIZING SYSTEM
| RESPONSE | RESPONDENTS |
| Yes | 136 |
| No | 3 |
| May be | 26 |
| Total | 165 |
DATA ON RESPONDENTS WILLING TO VOLUNTEER FOR INDIAN SIZING SYSTEM OR NOT
| RESPONSE | RESPONDENTS |
| Yes | 83 |
| No | 15 |
| May be | 67 |
| Total | 165 |
RESPONDENTS COMFORTNESS TOWARDS DIFFERENT SIZING METHODS
| Type of Methods | Comfortable | Not Comfortable | Total |
| Traditional Methods | 106 | 59 | 165 |
| 3D Body Scanning | 138 | 27 | 165 |
CALCULATION OF MEAN, MEDIAN, MODE AND STANDARD DEVIATION
OBJECTIVE: Calculation of the mean, median, mode and standard deviation of the age group of the participants.
| Age Interval | Frequency |
| 18-21 | 118 |
| 22-25 | 34 |
| 26-29 | 4 |
| 30-33 | 4 |
| 34-37 | 1 |
| 38-41 | 2 |
| 42-45 | 1 |
| 46-48 | 1 |
Solution:
| Age interval | Frequency(f) | Mid value (m) | f * m | Cumulative frequency (cf) |
| 18-21 | 118 | 19.5 | 2301.00 | 118 |
| 22-25 | 34 | 23.5 | 799.00 | 152 |
| 26-29 | 4 | 27.5 | 110.00 | 156 |
| 30-33 | 4 | 31.5 | 126.00 | 160 |
| 34-37 | 1 | 35.5 | 35.50 | 161 |
| 38-41 | 2 | 39.5 | 79.00 | 163 |
| 42-45 | 1 | 43.5 | 43.50 | 164 |
| 46-49 | 1 | 47.5 | 47.50 | 165 |
| n = 165 | f *m = 3541.50 |
![]()
To find Median Class
= value of (n/2)th observation
= value of (165/2)th observation
= value of 82nd observation
From the column of cumulative frequency cf, we find that the 82nd observation lies in the class 18-21.
∴ The median class is 18-21.
Now,
L=lower boundary point of median class =18
n=Total frequency =165
cf=Cumulative frequency of the class preceding the median class =0
f=Frequency of the median class =118
c=class length of median class =3
![]()
To find Mode Class
Here, maximum frequency is 118.
The mode class is 17.5-21.5.
L=lower boundary point of mode class =17.5
f1= frequency of the mode class =118
f0= frequency of the preceding class =0
f2= frequency of the succeeding class =34
c= class length of mode class =4
![]()
![]()
=19.8366
For Standard Deviation
| Age interval | f | m | Mean | m – | (m – )2 | f *(m-x)2 |
| 18-21 | 118 | 19.5 | 21.46 | -1.96 | 3.84 | 453.12 |
| 22-25 | 34 | 23.5 | 21.46 | 2.04 | 4.16 | 141.44 |
| 26-29 | 4 | 27.5 | 21.46 | 6.04 | 36.48 | 145.92 |
| 30-33 | 4 | 31.5 | 21.46 | 10.04 | 100.80 | 403.20 |
| 34-37 | 1 | 35.5 | 21.46 | 14.04 | 197.12 | 197.12 |
| 38-41 | 2 | 39.5 | 21.46 | 18.04 | 325.44 | 650.88 |
| 42-45 | 1 | 43.5 | 21.46 | 22.04 | 485.76 | 485.76 |
| 46-49 | 1 | 47.5 | 21.46 | 26.04 | 678.08 | 678.08 |
| n = 165 | 3155.52 |
![]()
| MEAN | |
| MEDIAN | 20.0975 |
| MODE | 19.8366 |
| STANDARD DEVIATION | 4.386 |
HYPOTHESIS TESTING
TEST 1: CHI SQUARE GOODNESS OF FIT TEST
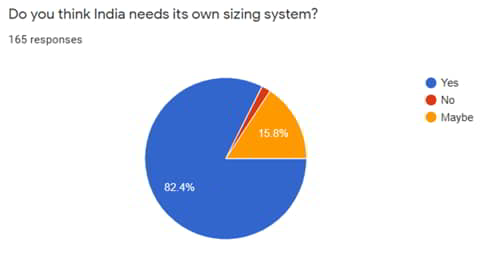
Question: Do you think India needs its own sizing system?
Response collected
RESEARCH HYPOTHESIS
In this study, the following hypothesis has been assumed to find out that whether the null hypothesis stand true or not.
- Null Hypothesis (H0):
- There is an equal probability of people needing the Indian sizing system and satisfied with present sizing system.
- Alternate Hypothesis (Ha):
- People are not satisfied with present sizing system and need their own Indian sizing system.
Analysis
As we are assuming the null hypothesis, where the outcomes have equal probability so the expected result would be 1/3rd of total sample (i.e., 165) as there are 3 choices.
Therefore, expected outcome can be
| Yes | No | Maybe | |
| Observed | 136 | 3 | 26 |
| Expected | 55 | 55 | 55 |

where, Oi = Observed value
Ei= Expected value
Degree of freedom = (rows-1) (columns -1) = (2-1) (3-1) = 2
| Observed | Expected | Difference | Difference Square | Difference Square/ Expected value | |
| Yes | 136 | 55 | 81.00 | 6561.00 | 119.29 |
| No | 3 | 55 | -52.00 | 2704.00 | 49.16 |
| Maybe | 26 | 55 | -29.00 | 841 | 15.29 |
| Chi squared
(χ2) |
183.745 |
Significance level (α) = 0.05(indicates a 5% risk of concluding that a difference exists when there is no actual difference)
Chi squared is equal to 183.745, therefore its p-value is .00001.
- p-value > 0.1: No evidence
- p-value between 0.05 and 0.1: Weak evidence
- p-value between 0.01 and 0.05: Evidence
- p-value between 0.001 and 0.01: Strong evidence
- p-value < 0.001: Very strong evidence
TEST 2: Z test for proportion
Proportion of Gender
RESEARCH HYPOTHESIS
In this study, the following hypothesis has been assumed to find out that whether the null hypothesis stand true or not.
- Null Hypothesis:
- H0 = Probability that number of male participants are equal to female participants.
- Alternate Hypothesis:
- Ha = Probability that number of male participants are not equal to female participants.

- z = calculated critical value.
- x = Observed success.
- n = Size of samples.
- p = Probability of success
- q or 1-p= Probability of failure
Here,
- n = 165
- X = 60 or 105
- p = 1/2
- 1-p = 1/2

Significance level = 0.05
At 0.05 Significance level Z is 1.96.
RESULT
Our observed value of Z is 3.51 which is greater than the critical value of 1.96. We therefore reject null hypothesis H0.
Question: Which part of the body feels uncomfortable in your ready-made garments?
Response collected
RESEARCH HYPOTHESIS
In this study, the following hypothesis has been assumed to find out that whether the null hypothesis stand true or not.
- Null Hypothesis:
- H0 = There is no difference between the size issue in formal, casual and party wear clothing.
- Alternate Hypothesis:
- Ha = There is difference between the size issue in formal, casual and party wear clothing.
Analysis
| Formal wear (A) | Casual wear (B) | Party wear (C) | |
| Bust | 56 | 32 | 42 |
| Waist | 40 | 20 | 42 |
| Hip | 20 | 7 | 24 |
Solution
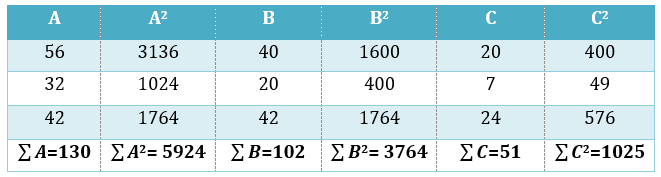
Data table
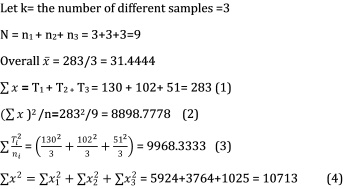
Step-1: sum of squares between samples
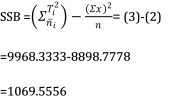
Step-2: sum of squares within samples
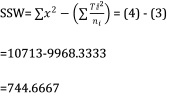
Step-3: Total sum of squares
SST= SSB + SSW
=1069.5556+744.6667
=1814.2222
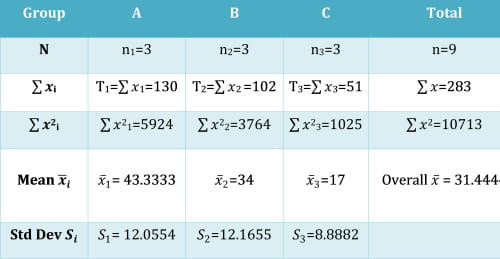
Step-4: variance between samples
MSB =SSB / k-1
=1069.5556/2
=534.7778
Step-5: variance within samples
MSW=SSW/ n–k
=744.6667/ 9-3
=744.6667/ 6
=124.1111
Step-6: test statistic F for one way ANOVA test
F=MSB / MSW
=534.7778 / 124.1111
=4.3089
- The degree of freedom between samples= k-1=2
- degree of freedom within samplesn–k = 9-3 = 6
ANOVA table
| Source of Variation | Sums of Squares SS |
Degrees of freedom DF |
Mean Squares MS |
F | p-value |
| Between samples | SSB = 1069.5556 | k-1 = 2 | MSB = 534.7778 | 4.3089 | 0.0692 |
| Within samples | SSW = 744.6667 | n–k = 6 | MSW = 124.1111 | ||
| Total | SST = 1814.2222 | n-1 = 8 |
RESULT
As calculated Fis 4.3089 which is smaller than 5.1433.
So, H0 is accepted, hence there is no difference between the size issue in formal, casual and party wear clothing.
F (2,6) at 0.05 level of significance=5.1433
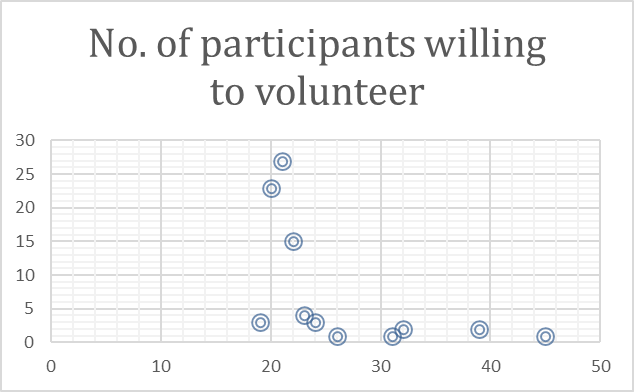
TEST 4: Pearson Correlation Coefficient test
Question: If a sizing survey is initiated, will you be willing to volunteer?
Response collected
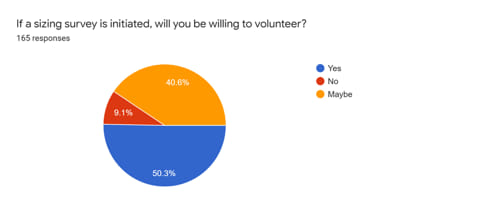
| Age | No. of people willing to volunteer |
| 19 | 3 |
| 22 | 15 |
| 31 | 1 |
| 39 | 2 |
| 23 | 4 |
| 20 | 23 |
| 45 | 1 |
| 24 | 3 |
| 21 | 27 |
| 26 | 1 |
| 32 | 2 |
RESEARCH HYPOTHESIS
In this study, the following hypothesis has been assumed to find out that whether the null hypothesis stand true or not.
- Null Hypothesis:
- H0 = There is no correlation between age of participants to number of participants willing to volunteer
- Alternate Hypothesis:
- Ha = There is correlation between age of participants to number of participants willing to volunteer.
Solution:
Let, X: Age of participants, Y: No. of people, Mx: Mean of X Values and My: Mean of Y Values
| X | Y |
| 19 | 3 |
| 22 | 15 |
| 31 | 1 |
| 39 | 2 |
| 23 | 4 |
| 20 | 23 |
| 45 | 1 |
| 24 | 3 |
| 21 | 27 |
| 26 | 1 |
| 32 | 2 |
| Sum = 302 | Sum= 82 |
| Mean (Mx)= 27.455 | My= 7.455 |
X – Mx & Y – My: Deviation scores
(X – Mx)2 & (Y – My)2: Deviation Squared
(X – Mx) (Y – My): Product of Deviation Scores
| X- Mx | Y-My | (X- Mx)2 | (Y-My)2 | (X- Mx) (Y-My) |
| -8.455 | -4.455 | 71.479 | 19.843 | 37.661 |
| -5.455 | 7.545 | 29.752 | 56.934 | -41.157 |
| 3.545 | -6.455 | 12.570 | 41.661 | -22.884 |
| 11.545 | -5.455 | 133.298 | 29.752 | -62.975 |
| -4.455 | -3.455 | 19.843 | 11.934 | 15.388 |
| -7.455 | 15.545 | 55.570 | 241.661 | -115.884 |
| 17.545 | -6.455 | 307.843 | 41.661 | -113.248 |
| -3.455 | -4.455 | 11.934 | 19.843 | 15.388 |
| -6.455 | 19.545 | 41.661 | 382.025 | -126.157 |
| -1.455 | -6.455 | 2.116 | 41.661 | 9.388 |
| 4.545 | -5.455 | 20.661 | 29.752 | -24.793 |
| Sum: 706.727 | Sum: 916.727 | Sum: -429.273 |

The value of r = -0.5333
Degree of correlation:
- Perfect: If the value is near ± 1, then it said to be a perfect correlation: as one variable increases, the other variable tends to also increase (if positive) or decrease (if negative).
- High degree: If the coefficient value lies between ± 0.50 and ± 1, then it is said to be a strong correlation.
- Moderate degree: If the value lies between ± 0.30 and ± 0.49, then it is said to be a medium correlation.
- Low degree: When the value lies below + .29, then it is said to be a small correlation.
RESULT
As r value is -0.5333, there is a negative correlation, which means there is a tendency for high X variable scores to go with low Y variable scores (and vice versa). Therefore, null hypothesis H0 is rejected.
TEST 5: Fisher’s Exact Method test
Question: Do you know that India does have their own sizing system?
Response collected
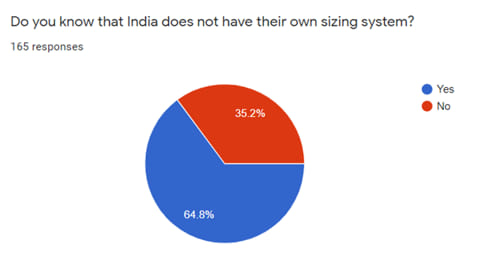
Response with respect to gender of participants
| Male | Female | Total | |
| Yes | 36 | 71 | 107 |
| No | 24 | 34 | 58 |
| Total | 60 | 105 | 165 |
RESEARCH HYPOTHESIS
In this study, the following hypothesis has been assumed to find out that whether the null hypothesis stand true or not.
- Null Hypothesis (H0):
- The gender of the participants has no association with having awareness aboutIndian sizing system.
- Alternate Hypothesis (Ha):
- The gender of the participants has association with having awareness about Indian sizing system.
Assigning alphabets to each data
| Male | Female | Total | |
| Yes | a = 36 | b = 71 | a +b = 107 |
| No | c = 24 | d = 34 | c +d = 58 |
| Total | a +c = 60 | b +d = 105 | N = 165 |
For Fisher’s Exact Test we use a mathematical method called Combination which helps us find out the value of p (two tailed) so that it can be compared with significance level (α) of 0.05 to check our hypothesis.

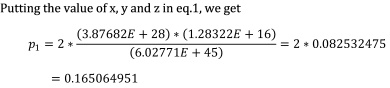
Similarly, we need to calculate p1, p2, p3, p4 3-4 times in which the data is altered by +1 and -1 alternatively in each row which will give the p-value (p1+p2+p3+p4).
Table 2
| Male | Female | Total | |
| Yes | 32 | 75 | 107 |
| No | 28 | 30 | 58 |
| Total | 60 | 105 | 165 |
Assigning alphabets to each data
| Male | Female | Total | |
| Yes | a = 32 | b = 75 | a+b = 107 |
| No | c = 28 | d = 30 | c+d = 58 |
| Total | a+c = 60 | b+d = 105 | N = 165 |
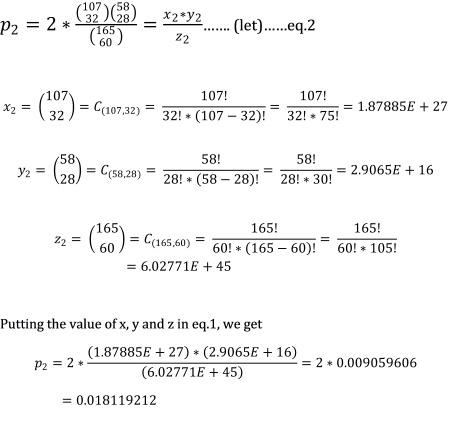
Table 3
| Male | Female | Total | |
| Yes | 33 | 74 | 107 |
| No | 27 | 31 | 58 |
| Total | 60 | 105 | 165 |
Assigning alphabets to each data-
| Male | Female | Total | |
| Yes | a = 33 | b = 75 | a+b = 107 |
| No | c = 27 | d = 31 | c+d = 58 |
| Total | a+c = 60 | b+d = 105 | N = 165 |

Table 4
| Male | Female | Total | |
| Yes | 34 | 73 | 107 |
| No | 26 | 32 | 58 |
| Total | 60 | 105 | 165 |
Assigning alphabets to each data –
| Male | Female | Total | |
| Yes | a = 34 | b = 73 | a+b = 107 |
| No | c = 26 | d = 32 | c+d = 58 |
| Total | a+c = 60 | b+d = 105 | N = 165 |
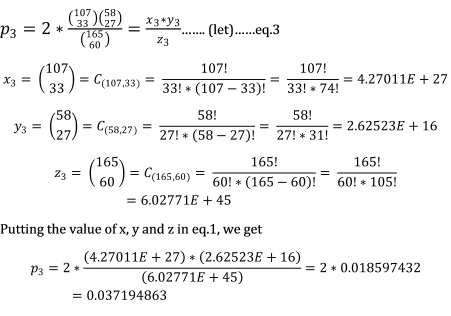
Table 5
| Male | Female | Total | |
| Yes | 35 | 72 | 107 |
| No | 25 | 33 | 58 |
| Total | 60 | 105 | 165 |
Assigning alphabets to each data –
| Male | Female | Total | |
| Yes | a = 35 | b = 72 | a+b = 107 |
| No | c = 25 | d = 33 | c+d = 58 |
| Total | a+c = 60 | b+d = 105 | N = 165 |
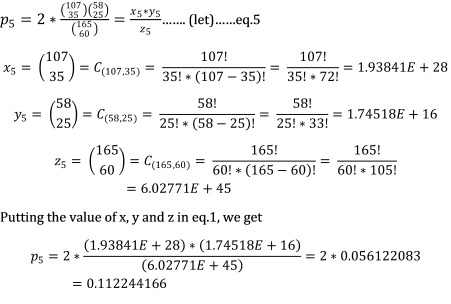
Calculating p-value for the Fisher’s Exact Test: –
p-value = p1 + p2 + p3 + p4 + p5
= 0.165064951 + 0.018119212 + 0.037194863 + 0.068304538 +0.112244166
= 0.40092773
RESULT
As p value is greater than significance level of 0.05, H0 is accepted. “The gender of the participants has no association with the knowledge of sizing system”, stands true.
CONCLUSION
We all know that India does not have its own sizing system. So, keeping this in mind I conducted survey about the knowledge of Indian sizing system, problem faced due to current sizing system, knowing the mindset to volunteer for the anthropometric data collection and so on. The survey included people from different ages, occupations, genders, geographic regions and so on.
Through this survey I proved my hypothesis, “India needs its own sizing system”.
I collected the data of the citizens and ran 5 hypothesis tests: –
- CHI SQUARE GOODNESS OF FIT TEST
- Z TEST FOR PROPORTION
- ONE WAY ANOVA TEST
- PEARSON CORRELATION COEFFICIENT TEST
- FISHER’S EXACT METHOD TEST
The tests concluded several results like
All the tests came out with the results in favor of our hypothesis that “India needs its own sizing system”.
REFERENCES
- Dey, S. (2019). Why India needs its own size chart for the right fit. Retrieved 26 May 2021, from https://www.livemint.com/industry/manufacturing/why-india-needs-its-own-size-chart-for-the-right-fit-1548305046228.html
- Gupta, D. (2010). Anthropometric Study of Young Indian Men for Garment Sizing. Research Journal Of Textile And Apparel, 14(1), 82-89. doi: 10.1108/rjta-14-01-2010-b009
- Jeyasingh, M., &Appavoo, K. (2012). Retrieved 26 May 2021, from http://www.mecs-press.com/ijitcs/ijitcs-v4-n6/IJITCS-V4-N6-2.pdf
- Kausher, H., & Srivastava, S. (2007). Developing Structured Sizing Systems for Manufacturing Ready-Made Garments of Indian Females Using Decision Tree-Based Data Mining. Retrieved 26 May 2021, from https://publications.waset.org/10010963/developing-structured-sizing-systems-for-manufacturing-ready-made-garments-of-indian-females-using-decision-tree-based-data-mining
- Mcculloch, C., Paal, B., & Ashdown, S. (2007). An optimisation approach to apparel sizing. Retrieved 26 May 2021, from https://www.tandfonline.com/doi/abs/10.1057/palgrave.jors.2600533
- Media coverage on INDIASize | NIFT. Retrieved 26 May 2021, from https://nift.ac.in/india-size
7. Vasesi, A. (2018). India Sizing soon to be a reality; set to boost Indian retail | Apparel Resources. Retrieved 26 May 2021, from https://in.apparelresources.com/business-news/retail/india-sizing-soon-reality-2/
ANNEXURE – QUESTIONNAIRE
SIZING SYSTEM
A sizing system is a table of numbers that represents the value of key dimensions used to classify the measurement of bodies encountered in the population. It is based on anthropometric data (measurement of humans) and is known as an anthropometric sizing system.
PURPOSE
This survey is for educational purpose only.
- Name: –
- Age: –
- Gender: –
- Male
- Female
- Non binary
- Prefer not to say
- Which part of India are you from?
- North
- South
- East
- West
- Occupation: –
- Do you know that India does not have their own sizing system?
- Yes
- No
- How regular do you need to buy new clothes?
Within a monthIn 3-4 months After 6 months In 9-10 months After 1 year
- Formals
- Jackets
- Denim Jeans
- Casual Wear
- Party Wear
- From where do you buy your clothes?
- Online
- In stores
- Custom Made
- Which part of the body feels uncomfortable in your ready-made garments?
Bust/Chest Waist Hips Fits perfectly
- Formals
- Jackets
- Denim Jeans
- Casual Wear
- Party Wear
- On a scale of 1 to 5, how comfortable are you with the universal sizing system?
1 = Extremely comfortable; 5 = Extremely uncomfortable
Extremely comfortable Comfortable Neutral Uncomfortable Extremely uncomfortable
- 1
- 2
- 3
- 4
- 5
- Do you think India needs its own sizing system?
- Yes
- No
- Maybe
- If a sizing survey is initiated, will you be willing to volunteer?
- Yes
- No
- Maybe
- For taking your whole-body measurements, which method would you find most comfortable?
Comfortable Not comfortable
- Traditional
- 3-D Body scanning


Hi Aryan Rathore, how can one reach you via email. Have quiries. You can write me through [email protected]